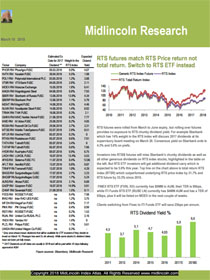
Emerging markets fund flow showed 4514.1 USD mn of inflow. While Frontier Markets funds showed -25.1 USD mn of outflows.
BRAZIL Equity funds showed -96.4 USD mn of outflow.
BRAZIL Fixed Income funds showed -25.6 USD mn of outflow.
CHINA Equity funds showed 602.9 USD mn of inflow.
CHINA Fixed Income funds showed -774.8 USD mn of outflow.
INDIA Equity funds showed 872.9 USD mn of inflow.
INDIA Fixed Income funds showed -3.7 USD mn of outflow.
KOREA Equity funds showed 695.7 USD mn of inflow.
RUSSIA Equity funds showed 90.3 USD mn of inflow.
Russia Fixed Income funds showed 0.0 USD mn of inflow.
SOUTH AFRICA Equity funds showed 157.6 USD mn of inflow.
TURKEY Equity funds showed -1762.5 USD mn of outflow.
COMMUNICATIONS SECTOR Equity funds showed 299.6 USD mn of inflow.
ENERGY SECTOR Equity funds showed 985.9 USD mn of inflow.
ENERGY SECTOR Mixed Allocation funds showed 2.0 USD mn of inflow.
FINANCIAL SECTOR Equity funds showed -660.3 USD mn of outflow.
REAL ESTATE SECTOR Equity funds showed -3458.9 USD mn of outflow.
TECHNOLOGY SECTOR Equity funds showed -306.1 USD mn of outflow.
UTILITIES SECTOR Equity funds showed 3114.1 USD mn of inflow.
LONG SHORT Alternative funds showed 376.3 USD mn of inflow.
LONG SHORT Equity funds showed -3167.7 USD mn of outflow.
LONG SHORT Fixed Income funds showed 15.0 USD mn of inflow.
LONG SHORT Mixed Allocation funds showed 20.1 USD mn of inflow.
Latest ML Comics
Markets
Market performance is between 2023-01-01 and 2022-12-01
Best global markets between 2023-01-01 and 2022-12-01 FM (FRONTIER MARKETS)-0.54%, EFM ASIA-1.08%, EUROPE-1.56%,
While worst global markets between 2023-01-01 and 2022-12-01 EM LATIN AMERICA -8.60%, USA -6.38%, EM (EMERGING MARKETS) -1.61%,
Best during the period among various stock markets were ZIMBABWE +70.33%, LEBANON +9.24%, TURKEY +9.23%, TRINIDAD AND TOBAGO +8.18%, ARGENTINA +8.11%, HONG KONG +7.55%, CHINA +6.57%, UKRAINE +6.54%, COLOMBIA +5.34%, DENMARK +5.28%,
While worst during the period among various stock markets were BRAZIL -10.18%, QATAR -9.13%, KOREA -8.39%, ISRAEL -7.82%, CHILE -7.40%, CANADA -6.63%, TAIWAN -6.60%, AUSTRALIA -6.47%, USA -6.38%, KUWAIT -6.35%,
Key Fund Flow Headlines
Bursa Malaysia CEO: 'Prohibitive ESG conversations won't win any ... Responsible Investor ESG may have run into an image problem outside developed markets, ... amid subdued ESG fund flows into global emerging markets more broadly... 1 day ago ETF Fund Flows For January 9, 2023 ETF.com Disclaimer: All data as of 6 a.m. Eastern time the date the article is published. Data is believed to be accurate; however, transient market... 22 hours ago Issuers Continue to Plan ESG-Related ETFs Yahoo Finance The fund will invest in equities in both emerging and developed markets, and will focus on companies likely to benefit from the transition... 1 day ago Money Market Funds Open New Year with $57.8 Billion Inflows ... Seeking Alpha U.S. Weekly FundFlows Insight Report: Money Market Funds Open New Year ... Growth/value-large cap ETFs realized positive weekly performance... 2 days ago Equity mutual fund inflows rise over 3-fold in Dec: AMFI The Indian Express Investors are looking forward to a growth-oriented budget which should have a positive impact on the markets,” said N S Venkatesh,... 4 hours ago Bursa Malaysia CEO: 'Prohibitive ESG conversations won't win any ... Responsible Investor ... amid subdued ESG fund flows into global emerging markets more broadly – down some 72 percent in 2022 compared with the previous year. 1 day ago Updating My Favorite Performance Chart For 2022 A Wealth of Common Sense Emerging markets were the best-performing asset class in 2017 and ... Did the present value of future cash flows for real estate really... 2 days ago Global equity funds see outflows for an eighth straight week Reuters According to data available for 24,668 emerging market (EM) funds, both equity and bond funds saw net weekly outflows, amounting $344... 1 week ago ‘We will see more sell-offs as earnings flow through’: Market expert Sandip Sabharwal MintGenie He spoke at length about the emerging market trends, ... majority of mutual fund schemes that had got disproportionate flows in the previous... 1 hour ago The worst may be over for emerging markets | Mint Mint In a flight to safety, foreign institutional investors (FIIs) shunned EMs. The Bloomberg Emerging Markets Capital Flow Proxy Index shows that... 2 days ago Equity Funds Return to Favour Morningstar Fixed income funds remained popular and look set to be only category to see positive inflows for 2022 as a whole. 3 weeks ago ETF industry storms through 2022's headwinds Financial Times But a number of asset classes went one better and chalked up their ... Chedid believed fixed income inflows in the first half of 2022 were... 1 day ago Record $1.5 Trillion Flow Widest on Record Between Mutual Funds ... Bloomberg.com Fund Flows for 2022 ... Mutual funds saw investors pull $480 billion out of fixed income, the first yearly outflow for the asset class since 2015. 3 weeks ago U.S. equity funds gain first weekly inflow in four weeks Yahoo Finance Graphic: Fund flows: US equities bonds and money market funds, ... U.S. bond funds continued to record outflows for a sixth week,... 3 weeks ago Debt fund flows to rise in 2023, 2-to-3 year corp bonds most lucrative ... Mint Debt fund flows to rise in 2023, 2-to-3 year corp bonds most lucrative: ABSL MF ... Indian government and corporate bond yields have been on an... 1 month ago
Top 20 Funds Longs Based on Momentum
| Name | 1week | 1month | ytd | 6months | 1yr | Rank |
| LYXOR ETF TURKEY EURO (TURU) | 11.75 | 4.5 | -3.07 | 93.71 | 85.13 | 48.77 |
| ISHARES MSCI TURKEY UCITS ETF (IDTK) | 11.64 | 3.46 | -3.85 | 90.81 | 82.24 | 47.04 |
| HSBC MSCI TURKEY UCITS ETF (HTRY) | 12.05 | 3.66 | -4.04 | 90.91 | 80.2 | 46.71 |
| MARKET VECTORS OIL SERVICE ETF (OIH) | 3.89 | 16.62 | 8.56 | 58 | 48.14 | 31.66 |
| ENERGY SELECT SECTOR SPDR FUND (XLE*) | 2.74 | 8.46 | 3.89 | 28.58 | 45.52 | 21.33 |
| SANTANDER FIC FI VALE 3 ACOES (REALRIO) | -0.33 | 10.74 | 6.92 | 48.62 | 25.22 | 21.06 |
| VANGUARD ENERGY ETF (VDE) | 2.34 | 7.23 | 2.82 | 28.58 | 44.16 | 20.58 |
| SAFRA VALE DO RIO DOCE FIC FIA (SAFVRDA) | -0.28 | 10.68 | 6.92 | 47.92 | 23.97 | 20.57 |
| DIREXION DAILY BRAZIL BULL 3X SHARES (BRZU) | 0.9 | 25.51 | 11.12 | 35.56 | 13.9 | 18.97 |
| FIDELITY SELECT NATURAL RESOURCES PORTFOLIO (FNARX) | 3.05 | 10.14 | 5.12 | 30.8 | 29.86 | 18.46 |
| ISHARES GLOBAL ENERGY ETF (ISQQ) | 3.5 | 7.49 | 3.98 | 24.72 | 35.14 | 17.71 |
| SPDR S&P METALS & MINING ETF (SSGG) | 3.2 | 13.9 | 11.31 | 25.21 | 22.37 | 16.17 |
| FRANKLIN STRATEGIC SERIES - FRANKLIN NATURAL RESOURCES FUND - A (FRNRX) | 1.76 | 8.52 | 5.69 | 27.99 | 26.36 | 16.16 |
| BLACKROCK WORLD MINING TRUST PLC (BRWM) | 2.28 | 13.58 | 8.94 | 35.93 | 11.01 | 15.70 |
| LYXOR ETF IBEX 35 DOBLE APALANCADO DIARIO (IBEXA) | 5.79 | 24.51 | 20.12 | 31.53 | 0.64 | 15.62 |
| STONE HARBOR EMERGING MARKETS INCOME FUND (EDF) | 13.6 | 22.96 | 26.21 | 28.55 | -4.21 | 15.23 |
| PRUDENTIAL JENNISON NATURAL RESOURCES FUND INC - Q (PJNQX) | 2.33 | 7.26 | 5.67 | 27.55 | 23.5 | 15.16 |
| SAFRA PETROBRAS FIC FIA (SAFPETR) | -1.3 | 10.09 | -0.59 | 18.27 | 32.34 | 14.85 |
| ISHARES MSCI BRAZIL UCITS ETF (INC) (IBZL) | 3.88 | 13.3 | 9.29 | 23.01 | 17.98 | 14.54 |
| BLACKROCK GLOBAL FUNDS - WORLD ENERGY FUND (H2Z6) | 4.66 | 10.26 | 5.41 | 25.11 | 17.6 | 14.41 |
Top 20 Funds Shorts Based on Momentum
| Name | 1week | 1month | ytd | 6months | 1yr | Rank |
| ZIF BREZA INVEST DD VARAZDIN (BRINRA) | 0.31 | -86.49 | -86.51 | -82.37 | -84.08 | -63.16 |
| LATIN AMERICAN DISCOVERY FUND INC/THE (LDF) | 29.59 | -16.06 | 1.4 | -72.99 | -87.99 | -36.86 |
| PROSHARES ULTRASHORT MSCI BRAZIL CAPPED (BZQ) | -0.95 | -24.44 | -13.14 | -46 | -48.01 | -29.85 |
| 49 NORTH RESOURCES INC (FNR) | -0.19 | -14.99 | 2.03 | -19.89 | -41.41 | -19.12 |
| LYXOR ETF IBEX 35 DOBLE INVERSO DIARIO (2INVE) | -3.77 | -16.36 | -14.87 | -18.93 | -23.65 | -15.68 |
| IPATH DOW JONES-UBS COFFEE SUBINDEX TOTAL RETURN ETN (JO) | 5.21 | -8.3 | -9.65 | -22.47 | -33.37 | -14.73 |
| ETFS COFFEE (COFF) | 6.61 | -6.35 | -10.69 | -22.63 | -33.36 | -13.93 |
| CENTRAL EUROPE RUSSIA AND TURKEY FUND INC/THE (CEE) | 3.02 | 11.62 | 11.5 | -7.18 | -60.26 | -13.20 |
| CENTRAL EUROPE RUSSIA AND TURKEY FUND INC/THE (XCEEX) | 0.14 | 9.4 | 6.83 | 14.68 | -72.1 | -11.97 |
| BROOKFIELD GLOBAL INFRASTRUCTURE SECURITIES INCOME FUND (BGI-U) | -3.66 | -4.14 | -4.66 | -17.29 | -22.04 | -11.78 |
| CAPITAL CHINA NEW OPPORTUNITY EQUITY FUND - USD (CAPGNEU) | 1.48 | 6.41 | 7.08 | -16.64 | -34.64 | -10.85 |
| MARKET VECTORS VIETNAM ETF (VNM) | 1.43 | 3.2 | 8.02 | -10.96 | -34.4 | -10.18 |
| DB PHYSICAL RHODIUM ETC (XRH0) | 0.95 | -6.32 | -5.75 | -8.32 | -25.8 | -9.87 |
| GABELLI MULTIMEDIA TRUST INC (GGT) | 3.06 | -2.72 | 6.92 | -13.66 | -25.17 | -9.62 |
| EASTSPRING INVESTMENTS - AFRICA EQUITY FUND - ED USD (ESAFEDU) | -2.16 | -4.11 | -3.85 | -5.47 | -25 | -9.19 |
| ETFS DAILY SHORT COPPER (SCOP) | -0.83 | -10.99 | -9.09 | -21.81 | -2.63 | -9.07 |
| Finex Russian Eurobonds ETF | 0.64 | -5.96 | 6.3 | -16 | -14.22 | -8.89 |
| MUTUAFONDO TECNOLOGICO FI (FOTECGL) | 1.61 | 3.97 | 7 | -9.07 | -31.85 | -8.84 |
| DB X-TRACKERS FTSE VIETNAM UCITS ETF (XVTD) | 4.19 | 7.35 | 11.11 | -12.95 | -33.94 | -8.84 |
| CHINA SOUTHERN GRAIN & OIL COMMODITY FUND (CSG0CMD) | 0.6 | 9.05 | 9.8 | -17.09 | -27.42 | -8.72 |
Best Funds last Month
| Name | yesterday | ytd | 1week | 1month | 6months | 1yr | Rank |
| LYXOR ETF IBEX 35 DOBLE APALANCADO DIARIO (IBEXA) | 1.85 | 20.12 | 5.79 | 24.51 | 31.53 | 0.64 | 15.62 |
| SIMPLEX CHINA BULL 2X H-SHARE ETF (1572) | 1.55 | 16.58 | -0.04 | 20.73 | -2.84 | -33.11 | -3.81 |
| KB CHINA MAINLAND A SHARE LEVERAGE SEC MASTER INVST TRUST-EQUITY-DERV FOF (3AF8884) | 2.76 | 15.53 | 6.97 | 17.37 | 0.63 | -21.18 | 0.95 |
| KB CHINA MAINLAND A SHARE LEVERAGE SEC FEEDER INVST TRUST-EQUITY-DERV FOF (3AF8926) | 2.75 | 15.42 | 6.93 | 17.15 | -0.46 | -22.92 | 0.17 |
| ISHARES EUROPEAN PROPERTY YIELD UCITS ETF (IPRP) | -0.14 | 14.66 | 3.52 | 16.92 | -2.8 | -30.02 | -3.09 |
| BLACKROCK GLOBAL FUNDS - CHINA FUND - HEDGE EURA2 (H2ZP) | 0.79 | 15.32 | 2.42 | 16.26 | 3.4 | -26.3 | -1.06 |
| MARKET VECTORS JUNIOR GOLD MINERS ETF (VE42) | -2.09 | 6.05 | -1.23 | 15.27 | 25.55 | -2.2 | 9.35 |
| BLACKROCK GLOBAL FUNDS - WORLD GOLD FUND - A2EUR HEDGED (H2ZG) | -0.33 | 11.32 | 1.53 | 15.17 | 32.26 | -11.81 | 9.29 |
| NEXT NOTES NIKKEI TOCOM LEVERAGED CRUDE OIL ETN (2038) | 7.46 | 9.96 | 19.22 | 14.39 | -13.66 | 23.34 | 10.82 |
| BLACKROCK GLOBAL FUNDS - WORLD MINING FUND (B92A) | 0.45 | 10.57 | 2.94 | 14.27 | 41.46 | -1.55 | 14.28 |
| AMUNDI ETF MSCI EM LATIN AMERICA UCITS ETF - EUR (AMEL) | 1.93 | 8.66 | 2.06 | 14.07 | 21.62 | 15.03 | 13.20 |
| LYXOR UCITS ETF CHINA ENTERPRISE HSCEI - USD (ASI) | 0.19 | 11.54 | 0.37 | 14.03 | 1.8 | -16.63 | -0.11 |
| SPDR S&P METALS & MINING ETF (SSGG) | -0.07 | 11.31 | 3.2 | 13.9 | 25.21 | 22.37 | 16.17 |
| SCHRODER BRICS SECURITIES FEEDER INVESTMENT TRUST A - EQUITY (0525291) | 0.56 | 8.45 | 2.39 | 13.76 | 10.6 | -22.09 | 1.17 |
| BLACKROCK WORLD MINING TRUST PLC (BRWM) | 1.24 | 8.94 | 2.28 | 13.58 | 35.93 | 11.01 | 15.70 |
| ISHARES MSCI SOUTH AFRICA ETF (ISVW) | -2.8 | 5.21 | 0.12 | 13.54 | 12.01 | -2.61 | 5.77 |
| HSBC GLOBAL INVESTMENT FUNDS - CHINESE EQUITY (JHSB) | -0.19 | 10.84 | 0.44 | 13.54 | 2.92 | -15.71 | 0.30 |
| BBVA ACCION IBEX 35 ETF (BBVAI) | 1.35 | 10.8 | 3.57 | 13.33 | 19.39 | 0.78 | 9.27 |
| ISHARES MSCI EM LATIN AMERICA (DLTM) | 1.29 | 8.89 | 3.26 | 13.32 | 21.9 | 13.8 | 13.07 |
| ISHARES MSCI BRAZIL UCITS ETF (INC) (IBZL) | 1.04 | 9.29 | 3.88 | 13.3 | 23.01 | 17.98 | 14.54 |
Worst Funds last Month
| Name | yesterday | ytd | 1week | 1month | 6months | 1yr | Rank |
| LYXOR ETF IBEX 35 DOBLE APALANCADO DIARIO (IBEXA) | 1.85 | 20.12 | 5.79 | 24.51 | 31.53 | 0.64 | 15.62 |
| SIMPLEX CHINA BULL 2X H-SHARE ETF (1572) | 1.55 | 16.58 | -0.04 | 20.73 | -2.84 | -33.11 | -3.81 |
| KB CHINA MAINLAND A SHARE LEVERAGE SEC MASTER INVST TRUST-EQUITY-DERV FOF (3AF8884) | 2.76 | 15.53 | 6.97 | 17.37 | 0.63 | -21.18 | 0.95 |
| KB CHINA MAINLAND A SHARE LEVERAGE SEC FEEDER INVST TRUST-EQUITY-DERV FOF (3AF8926) | 2.75 | 15.42 | 6.93 | 17.15 | -0.46 | -22.92 | 0.17 |
| ISHARES EUROPEAN PROPERTY YIELD UCITS ETF (IPRP) | -0.14 | 14.66 | 3.52 | 16.92 | -2.8 | -30.02 | -3.09 |
| BLACKROCK GLOBAL FUNDS - CHINA FUND - HEDGE EURA2 (H2ZP) | 0.79 | 15.32 | 2.42 | 16.26 | 3.4 | -26.3 | -1.06 |
| MARKET VECTORS JUNIOR GOLD MINERS ETF (VE42) | -2.09 | 6.05 | -1.23 | 15.27 | 25.55 | -2.2 | 9.35 |
| BLACKROCK GLOBAL FUNDS - WORLD GOLD FUND - A2EUR HEDGED (H2ZG) | -0.33 | 11.32 | 1.53 | 15.17 | 32.26 | -11.81 | 9.29 |
| NEXT NOTES NIKKEI TOCOM LEVERAGED CRUDE OIL ETN (2038) | 7.46 | 9.96 | 19.22 | 14.39 | -13.66 | 23.34 | 10.82 |
| BLACKROCK GLOBAL FUNDS - WORLD MINING FUND (B92A) | 0.45 | 10.57 | 2.94 | 14.27 | 41.46 | -1.55 | 14.28 |
| AMUNDI ETF MSCI EM LATIN AMERICA UCITS ETF - EUR (AMEL) | 1.93 | 8.66 | 2.06 | 14.07 | 21.62 | 15.03 | 13.20 |
| LYXOR UCITS ETF CHINA ENTERPRISE HSCEI - USD (ASI) | 0.19 | 11.54 | 0.37 | 14.03 | 1.8 | -16.63 | -0.11 |
| SPDR S&P METALS & MINING ETF (SSGG) | -0.07 | 11.31 | 3.2 | 13.9 | 25.21 | 22.37 | 16.17 |
| SCHRODER BRICS SECURITIES FEEDER INVESTMENT TRUST A - EQUITY (0525291) | 0.56 | 8.45 | 2.39 | 13.76 | 10.6 | -22.09 | 1.17 |
| BLACKROCK WORLD MINING TRUST PLC (BRWM) | 1.24 | 8.94 | 2.28 | 13.58 | 35.93 | 11.01 | 15.70 |
| ISHARES MSCI SOUTH AFRICA ETF (ISVW) | -2.8 | 5.21 | 0.12 | 13.54 | 12.01 | -2.61 | 5.77 |
| HSBC GLOBAL INVESTMENT FUNDS - CHINESE EQUITY (JHSB) | -0.19 | 10.84 | 0.44 | 13.54 | 2.92 | -15.71 | 0.30 |
| BBVA ACCION IBEX 35 ETF (BBVAI) | 1.35 | 10.8 | 3.57 | 13.33 | 19.39 | 0.78 | 9.27 |
| ISHARES MSCI EM LATIN AMERICA (DLTM) | 1.29 | 8.89 | 3.26 | 13.32 | 21.9 | 13.8 | 13.07 |
| ISHARES MSCI BRAZIL UCITS ETF (INC) (IBZL) | 1.04 | 9.29 | 3.88 | 13.3 | 23.01 | 17.98 | 14.54 |
Best Funds YTD
| Name | yesterday | ytd | 1week | 1month | 6months | 1yr | Rank |
| SAMSUNG KODEX 200 EXCHANGE TRADED FUNDS (1313) | 0.14 | 20.14 | 1.88 | 6.88 | 4.41 | -23.41 | -2.56 |
| LYXOR ETF IBEX 35 DOBLE APALANCADO DIARIO (IBEXA) | 1.85 | 20.12 | 5.79 | 24.51 | 31.53 | 0.64 | 15.62 |
| SIMPLEX CHINA BULL 2X H-SHARE ETF (1572) | 1.55 | 16.58 | -0.04 | 20.73 | -2.84 | -33.11 | -3.81 |
| KB CHINA MAINLAND A SHARE LEVERAGE SEC MASTER INVST TRUST-EQUITY-DERV FOF (3AF8884) | 2.76 | 15.53 | 6.97 | 17.37 | 0.63 | -21.18 | 0.95 |
| KB CHINA MAINLAND A SHARE LEVERAGE SEC FEEDER INVST TRUST-EQUITY-DERV FOF (3AF8926) | 2.75 | 15.42 | 6.93 | 17.15 | -0.46 | -22.92 | 0.17 |
| BLACKROCK GLOBAL FUNDS - CHINA FUND - HEDGE EURA2 (H2ZP) | 0.79 | 15.32 | 2.42 | 16.26 | 3.4 | -26.3 | -1.06 |
| ISHARES EUROPEAN PROPERTY YIELD UCITS ETF (IPRP) | -0.14 | 14.66 | 3.52 | 16.92 | -2.8 | -30.02 | -3.09 |
| ALLIANZ EUROPE EQUITY GROWTH - AEUR (UQ2A) | 1.2 | 12.19 | 4.6 | 11.01 | 11.48 | -16.76 | 2.58 |
| ISHARES BRIC 50 UCITS ETF (BRIC) | -0.07 | 11.9 | -0.09 | 12.29 | 5.86 | -20.44 | -0.60 |
| LYXOR UCITS ETF CHINA ENTERPRISE HSCEI - USD (ASI) | 0.19 | 11.54 | 0.37 | 14.03 | 1.8 | -16.63 | -0.11 |
| ALLIANZ EUROPE EQUITY GROWTH - CTEUR (UQ23) | 0.58 | 11.38 | 3.29 | 11.32 | 10.35 | -18.97 | 1.50 |
| BLACKROCK GLOBAL FUNDS - WORLD GOLD FUND - A2EUR HEDGED (H2ZG) | -0.33 | 11.32 | 1.53 | 15.17 | 32.26 | -11.81 | 9.29 |
| SPDR S&P METALS & MINING ETF (SSGG) | -0.07 | 11.31 | 3.2 | 13.9 | 25.21 | 22.37 | 16.17 |
| ISHARES MSCI NETHERLANDS ETF (ISVR) | 1.06 | 11.27 | 3.57 | 10.94 | 14.05 | -12.35 | 4.05 |
| LYXOR ETF DAX (DAXX) | 0.7 | 11.2 | 2.59 | 11.86 | 21.19 | -8.41 | 6.81 |
| DB X-TRACKERS FTSE VIETNAM UCITS ETF (XVTD) | 0.8 | 11.11 | 4.19 | 7.35 | -12.95 | -33.94 | -8.84 |
| XIE SHARES THAILAND SET50 ETF (3069) | -0.23 | 11 | 1.06 | 11.5 | 10.54 | -9.01 | 3.52 |
| LYXOR ETF DAX (DAX) | 0.55 | 10.92 | 2.53 | 11.7 | 21.36 | -8.38 | 6.80 |
| FIDELITY FUNDS - CHINA FOCUS FUND (FFFLU) | 0.24 | 10.92 | 1.61 | 12.51 | 10.85 | 4.53 | 7.38 |
| HSBC GLOBAL INVESTMENT FUNDS - CHINESE EQUITY (JHSB) | -0.19 | 10.84 | 0.44 | 13.54 | 2.92 | -15.71 | 0.30 |
Worst Funds YTD
| Name | yesterday | ytd | 1week | 1month | 6months | 1yr | Rank |
| LYXOR ETF IBEX 35 DOBLE INVERSO DIARIO (2INVE) | -0.5 | -14.87 | -3.77 | -16.36 | -18.93 | -23.65 | -15.68 |
| ETFS NICKEL (NICK) | -0.99 | -12.18 | -2.39 | -6.88 | 19.55 | 21.09 | 7.84 |
| ETFS COFFEE (COFF) | 1.06 | -10.69 | 6.61 | -6.35 | -22.63 | -33.36 | -13.93 |
| SIMPLEX CHINA BEAR 1X H-SHARE ETF (1573) | 0.22 | -9.05 | 1.19 | -10.77 | -9.15 | -3.25 | -5.50 |
| LYXOR ETF FTSE MIB DAILY SHORT BEAR (BERMIB) | 0.52 | -7.58 | -0.78 | -6.81 | -15.36 | -9.49 | -8.11 |
| DB X-TRACKERS SHORTDAX DAILY UCITS ETF (XSDX) | 0.83 | -6.26 | -0.2 | -6.28 | -7.6 | -5.59 | -4.92 |
| HSBC MSCI TURKEY UCITS ETF (HTRY) | 0.92 | -4.04 | 12.05 | 3.66 | 90.91 | 80.2 | 46.71 |
| LYXOR ETF TURKEY EURO (TURU) | 1.27 | -3.07 | 11.75 | 4.5 | 93.71 | 85.13 | 48.77 |
| FIRST JANATA BANK MUTUAL FUND (1JANATA) | -0.92 | -2.11 | -0.55 | -1.04 | -1.8 | -14.69 | -4.52 |
| ABERDEEN LATIN AMERICA EQUITY FUND INC (LT4) | 1.39 | -0.73 | 2.14 | 5.77 | 27.22 | 3.94 | 9.77 |
| ISHARES MSCI INDIA INDEX ETF (INDIAS) | 1.06 | -0.62 | 1.16 | -0.51 | 1.38 | -11.97 | -2.49 |
| ETFS AGRICULTURE DJ-UBSCI (AIGA) | 1 | -0.56 | 3.06 | 2.82 | 10.7 | 12.39 | 7.24 |
| CONSUMER STAPLES SELECT SECTOR SPDR FUND (SD7I) | 1.77 | -0.14 | 0.03 | 1.39 | 4.16 | 1.05 | 1.66 |
| MIRAE ROGERS AGRICULTURAL PRODUCT INDEX SPECIAL ASSET INVEST CMDTY-DERIVATIVE (5620974) | 0.25 | 0.06 | 1.7 | 6.66 | 6.55 | 0.73 | 3.91 |
| BLACKROCK GLOBAL FUNDS - WORLD HEALTHSCIENCE FUND - EURA2 (ERDV) | 1.04 | 0.21 | 1.58 | 0.56 | 4.86 | 3.01 | 2.50 |
| BARRAMUNDI LTD (BRM) | 2.3 | 0.53 | 3.54 | 3.04 | -8.56 | -24.76 | -6.69 |
| MIRAE ASSET TIGER CONSUMER STAPLES ETF (139280) | 0.61 | 1 | 0.8 | 4.04 | 2.32 | -7.52 | -0.09 |
| HSBC MSCI INDONESIA UCITS ETF (HIDD) | 1.04 | 1.02 | 5.94 | 1.07 | 5.37 | 3.54 | 3.98 |
| SCHRODER INTERNATIONAL SELECTION FUND - ASIAN BOND ABSOLUTE RETURN - C (HV81) | 0.05 | 1.02 | 0.47 | 1.72 | 2.36 | -1.49 | 0.76 |
| HSBC GLOBAL INVESTMENT FUNDS - INDIAN EQUITY (JHSC) | 0.31 | 1.12 | 0.52 | 0.63 | 4.86 | -12.05 | -1.51 |
Best Funds 1yr
| Name | yesterday | ytd | 1week | 1month | 6months | 1yr | Rank |
| LYXOR ETF TURKEY EURO (TURU) | 1.27 | -3.07 | 11.75 | 4.5 | 93.71 | 85.13 | 48.77 |
| HSBC MSCI TURKEY UCITS ETF (HTRY) | 0.92 | -4.04 | 12.05 | 3.66 | 90.91 | 80.2 | 46.71 |
| ISHARES GLOBAL ENERGY ETF (ISQQ) | 1.36 | 3.98 | 3.5 | 7.49 | 24.72 | 35.14 | 17.71 |
| NEXT NOTES NIKKEI TOCOM LEVERAGED CRUDE OIL ETN (2038) | 7.46 | 9.96 | 19.22 | 14.39 | -13.66 | 23.34 | 10.82 |
| SPDR S&P METALS & MINING ETF (SSGG) | -0.07 | 11.31 | 3.2 | 13.9 | 25.21 | 22.37 | 16.17 |
| ETFS NICKEL (NICK) | -0.99 | -12.18 | -2.39 | -6.88 | 19.55 | 21.09 | 7.84 |
| JPMORGAN FUNDS - GLOBAL NATURAL RESOURCES FUND (JP5B) | 0.27 | 7.03 | 1.71 | 10.03 | 24.85 | 18.06 | 13.66 |
| ISHARES MSCI BRAZIL UCITS ETF (INC) (IBZL) | 1.04 | 9.29 | 3.88 | 13.3 | 23.01 | 17.98 | 14.54 |
| BLACKROCK GLOBAL FUNDS - WORLD ENERGY FUND (H2Z6) | 1.12 | 5.41 | 4.66 | 10.26 | 25.11 | 17.6 | 14.41 |
| WTI CRUDE OIL PRICE LINKED ETF (1671) | 3.49 | 3.29 | 10.67 | 8.28 | -10.5 | 16.09 | 6.14 |
| NEXT FUNDS IBOVESPA LINKED EXCHANGE TRADED FUND (1325) | -0.77 | 3.68 | 4.21 | 4.56 | 15.79 | 15.75 | 10.08 |
| AMUNDI ETF MSCI EM LATIN AMERICA UCITS ETF - EUR (AMEL) | 1.93 | 8.66 | 2.06 | 14.07 | 21.62 | 15.03 | 13.20 |
| ISHARES MSCI EM LATIN AMERICA (DLTM) | 1.29 | 8.89 | 3.26 | 13.32 | 21.9 | 13.8 | 13.07 |
| JPMORGAN FUNDS - LATIN AMERICA EQUITY FUND (JPJ0) | 0.74 | 8.45 | 2.15 | 12.98 | 22.33 | 13.14 | 12.65 |
| ETFS AGRICULTURE DJ-UBSCI (AIGA) | 1 | -0.56 | 3.06 | 2.82 | 10.7 | 12.39 | 7.24 |
| BARING GLOBAL UMBRELLA - BARING GLOBAL RESOURCES FUND - A$INC (BYQN) | 0.86 | 5.56 | 2.44 | 8.7 | 22.56 | 12 | 11.42 |
| BLACKROCK GLOBAL FUNDS - LATIN AMERICA FUND - EURA2 (ERDP) | 0.72 | 7.12 | 2.43 | 12.47 | 22.92 | 11.37 | 12.30 |
| FRANKLIN TEMPLETON INVESTMENT FUNDS - TEMPLETON LATIN AMERICA FUND - A YDISEUR (XQ1H) | 1.42 | 7.19 | 0.8 | 11.71 | 16.9 | 11.26 | 10.17 |
| BLACKROCK WORLD MINING TRUST PLC (BRWM) | 1.24 | 8.94 | 2.28 | 13.58 | 35.93 | 11.01 | 15.70 |
| BNY MELLON GLOBAL FUNDS PLC - BRAZIL EQUITY FUND (HZ5R) | 0.26 | 5.85 | 1.14 | 12.89 | 13.53 | 7.8 | 8.84 |
Worst Funds 1yr
| Name | yesterday | ytd | 1week | 1month | 6months | 1yr | Rank |
| LATIN AMERICAN DISCOVERY FUND INC/THE (LDF) | 7.49 | 1.4 | 29.59 | -16.06 | -72.99 | -87.99 | -36.86 |
| DB X-TRACKERS FTSE VIETNAM UCITS ETF (XVTD) | 0.8 | 11.11 | 4.19 | 7.35 | -12.95 | -33.94 | -8.84 |
| ETFS COFFEE (COFF) | 1.06 | -10.69 | 6.61 | -6.35 | -22.63 | -33.36 | -13.93 |
| SIMPLEX CHINA BULL 2X H-SHARE ETF (1572) | 1.55 | 16.58 | -0.04 | 20.73 | -2.84 | -33.11 | -3.81 |
| MONTANARO EUROPEAN SMALLER COS TRUST PLC (MTE) | -0.32 | 3.79 | 1.28 | 5.19 | 3.09 | -32.64 | -5.77 |
| ISHARES EUROPEAN PROPERTY YIELD UCITS ETF (IPRP) | -0.14 | 14.66 | 3.52 | 16.92 | -2.8 | -30.02 | -3.09 |
| LYXOR ETF MSCI WORLD TELECOMMUNICATION SERVICES TR (LYPI) | 0.62 | 7.6 | 1.29 | 7.04 | -7.77 | -29.77 | -7.30 |
| FRANKLIN TEMPLETON INVESTMENT FUNDS - TEMPLETON ASIAN GROWTH FUND - N HEDGED 1 (XQ12) | -0.24 | 6.93 | 1.04 | 8.36 | 3.64 | -27.81 | -3.69 |
| BLACKROCK GLOBAL FUNDS - CHINA FUND - HEDGE EURA2 (H2ZP) | 0.79 | 15.32 | 2.42 | 16.26 | 3.4 | -26.3 | -1.06 |
| ISHARES NORTH AMERICAN TECH ETF (ISQ8) | 2.53 | 6.01 | 4.29 | 5.12 | -7.02 | -26.2 | -5.95 |
| PICTET - DIGITAL COMMUNICATION - P$ (PBF1) | 2.23 | 10.3 | 1.78 | 9.25 | -2.63 | -26.07 | -4.42 |
| DB X-TRACKERS II IBOXX GLOBAL INFLATION-LINKED UCITS ETF-GBP (X03E) | 0.62 | 4.73 | 2.95 | 0.56 | -7.1 | -25.05 | -7.16 |
| FRANKLIN TEMPLETON INVESTMENT FUNDS - TEMPLETON BRIC FUND (F7RH) | 0.92 | 9.21 | 1.72 | 12.46 | 12.65 | -25.02 | 0.45 |
| BARRAMUNDI LTD (BRM) | 2.3 | 0.53 | 3.54 | 3.04 | -8.56 | -24.76 | -6.69 |
| ISHARES MSCI POLAND UCITS ETF (IPOL) | 0.07 | 7.06 | 0.01 | 11.25 | 21.6 | -24.72 | 2.04 |
| ISHARES MSCI TAIWAN UCITS ETF (ITWN) | 0.57 | 10.22 | 2.93 | 7.56 | 1.52 | -24.14 | -3.03 |
| SOURCE CONS DISC S&P US SECTOR (XLYS) | 0.38 | 8.54 | 2.18 | 4.65 | -6.37 | -24.01 | -5.89 |
| AMUNDI ETF MSCI EASTERN EUROPE EX RUSSIA UCITS ETF - EUR (CE9U) | 0.08 | 7.86 | -0.13 | 10.66 | 16.23 | -23.87 | 0.72 |
| LYXOR ETF IBEX 35 DOBLE INVERSO DIARIO (2INVE) | -0.5 | -14.87 | -3.77 | -16.36 | -18.93 | -23.65 | -15.68 |
| SAMSUNG KODEX 200 EXCHANGE TRADED FUNDS (1313) | 0.14 | 20.14 | 1.88 | 6.88 | 4.41 | -23.41 | -2.56 |


 Download All Slides in Power Point
