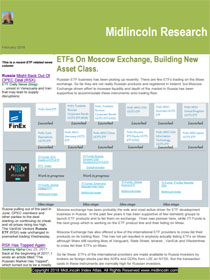
image
Midlincoln Index Atlas March 14, 2022
If your are viewing this document on a mobile device click here to skip part with data and go directly to content part

Top 20 Long Index Ideas YTD From Best to Worst

objectiveYTD
BRAZIL17.98
PERU16.14
CHILE14.84
ENERGY14.02
MIDDLE EAST REGION11.44
D0A3YNAMIC ALLOCATION10.66
ENHANCED MMKT (NON-US)10.66
MACRO (FOHF)10.66
SHORT BIASED10.66
ENERGY SECTOR9.75
SOUTH AFRICA8.93
TURKEY8.56
GCC8.28
INDUSTRIAL METALS8.17
EQUITY HEDGE (FOHF)7.69
AGRICULTURE7.47
THAILAND7.32
MENA7.10
AGGREGATE BOND USD FOCUSED6.97
LATIN AMERICAN REGION6.83

Top 20 Short Index Ideas YTD From Best to Worst

objectiveYTD
ARGENTINA-24.42
RUSSIA-21.03
NORDIC REGION-15.01
DENMARK-14.83
NETHERLANDS-13.78
TECHNOLOGY-12.75
TECHNOLOGY SECTOR-12.32
FRANCE-12.30
GROWTH MID CAP-10.67
FINLAND-10.46
HEALTH CARE-9.55
EASTERN EUROPEAN REGION-9.06
NORTH AMERICAN REGION-8.98
HEALTH CARE SECTOR-8.83
EUROPEAN REG. EX UK-8.77
AGGRESSIVE ALLOCAT00004E4BION-8.76
EVENT DRIVEN DIVERSIFIED-8.76
MACRO SYSTEMATIC DIVERSIFIED-8.76
MANAGED FUTURES CURRENCY-8.76
MANAGED FUTURES DISCRETIONARY-8.76

Combined Performance of Tracked Indexes by Index Provider Top 20 Winners

sourcenameytd
ICE Benchmark Administration43.18666666666667
Poland Warsaw Interbank Rates37.96
CQG18.8
London Metal Exchange - LME16.365000000000002
Diapason Commodities15.8
Nigerian Stock Exchange12.64
BOVESPA12.1
Saudi Arabian Stock Exchange11.44
Tokyo Commodity Exchange10.695
Banco Central do Brasil10.66
Bolsa de Comercio de Santiago10.47
BM&FBOVESPA10.22
Market Vectors Index Solutions9.67
Bahrain Bourse7.61
NASDAQ OMX PSX7.27
Markit6.4750000000000005
ProShares6.28
Shanghai Gold Exchange Contrac4.79
Deutsche Bank4.765000000000001
Mauritius Stock Exchange4.71

Combined Performance of Tracked Indexes by Index Provider Top 20 Losers

sourcenameytd
RTS Exchange-29.53
Cohen and Steers-12.059999999999999
NYSE Euronext Amsterdam-10.629999999999999
NYSE Euronext Brussels-9.37
Russell-9.334799999999998
NASDAQ OMX-9.282
Six Swiss Exchange-8.78375
CRSP-8.5825
NASDAQ Global Market-7.62962962962963
STOXX-7.395999999999998
Shenzhen Stock Exchange-7.38
KOSPI Stock Market-7.142500000000001
Tokyo Stock Exchange-6.62
Chicago Board Options Exchange-6.093333333333334
National Stock Exchange of Ind-5.905
Taiwan Stock Exchange-4.98
FNGuide Inc-4.888571428571429
Dow Jones-4.710810810810811
China Securities Index Co., Lt-4.59
Colombo Stock Exchange-4.36

Chart: Index Strategy

Feb 2022

Source:

Download All Slides in Power Point
  • InDex Pharmaceuticals prepares for commercialisation of cobitolimod Yahoo Finance
  • World shares mixed, Hong Kong index dives 5.4% WRAL
  • Cook Finance launches first composable index, strategy execution platform on BNB Chain Cointelegraph
  • An ESG Solution For Every Objective: S&P 500 ESG-Based Indices Seeking Alpha
  • Methodology Matters With This ESG ETF Nasdaq
  • World shares mixed, Hong Kong index dives 5.4% The Bakersfield Californian
  • This investment strategy is an extremely effective way to beat the S&P 500 MarketWatch
  • Methodology Matters With This ESG ETF ETF Trends

    Key Topics and News

    Index Ideas YTD From Best to Worst
    Top 20 Short Index Ideas YTD From Best to Worst
    Combined Performance of Tracked Indexes by Index Provider Top Winners
    Combined Performance of Tracked Indexes by Index Provider Top Losers

    Recent Index Atlas Ideas ChartArt

    Index Strategy

    Download file in Power Point
    Index Strategy

    Download file in Power Point
    Index Strategy

    Download file in Power Point
    ML Index Strategy

    Download file in Power Point
    Index Strategy

    Download file in Power Point
    Index Strategy

    Download file in Power Point
    Index Strategy

    Download file in Power Point
    Index Strategy

    Download file in Power Point
    Index Strategy

    Download file in Power Point

    Index Rebalancing News

    MSCI

  • MSCI Announces Quarterly Index Review, China Grows ETF Trends
  • Russia faces fund exodus as sanctions prompt changes in bond, equity indices South China Morning Post
  • Asset owners rebalance amid rough markets Pensions & Investments
  • MSCI, FTSE remove univestable Russian stocks from indices; no inflow benefit to India, other EM countries The Financial Express
  • Vanguard, Northern Trust ESG Funds Added Russia Bets Before War AdvisorHub
  • FM ETF: Combines Frontier And Select EM Countries Into One Fund Seeking Alpha
  • Russia exodus tests fund managers’ liquidity limit Nasdaq
  • What is ESG Investing? MSCI Ratings Focus on Corporate Bottom ... Bloomberg.com
  • 5 EM stocks trading at big discounts to their developed market ... Livewire Markets

    Standard & Poor's Index

  • Asset owners rebalance amid rough markets Pensions & Investments
  • TortoiseEcofin Announces Index Updates for First Quarter 2022 Digital Journal
  • Don’t cut investment ‘flowers’ without looking at the whole garden The Seattle Times
  • Charles Schwab Set to Join S&P 100; BellRing Brands to Join S&P ... PR Newswire
  • A tactical portfolio rebalancing can cut your risks in troubling times Financial Post
  • Kidney Health for All – Bridging the Gap in Kidney Health Education ... Renal and Urology News
  • India and the Global Commons: A Case Study of the International Solar Alliance ORF
  • Impacts of poverty alleviation on national and global carbon emissions Nature
  • S&P 500® | S&P Dow Jones Indices S&P Global

    Hang Seng

  • SMIC, Nongfu, Feihe tipped to join Hang Seng in latest index review South China Morning Post
  • Hang Seng sinks on Meituan sell-off as Covid, Ukraine jitters sap appetite South China Morning Post
  • Hong Kong index compiler adds Nongfu Spring, Lenovo to gauge South China Morning Post
  • Hang Seng Index revamp dents Tencent, AIA while two new joiners surge South China Morning Post
  • Hang Seng Index adds three stocks to kick off biggest overhaul in 52 years South China Morning Post
  • Dental Biomaterials Market size worth $ 12.47 Billion, Globally, by 2028 at 7.29% CAGR: Verified Market Research® Yahoo Finance
  • Payment Card Market Next Big Thing : Major Giants Diner's Club ... Digital Journal
  • Commercial & Corporate Card Market 2022 Global Industry Size ... The Bollywood Ticket
  • Credit Cards Market by Key Player – , American Express, Banco Itaú ... The Bollywood Ticket

    FTSE

  • FTSE Russell says annual indexes reconstitution to occur in late June Reuters
  • Russian stocks Evraz and Polymetal set to lose FTSE 100 status Yahoo Finance
  • MSCI, FTSE remove univestable Russian stocks from indices; no inflow benefit to India, other EM countries The Financial Express
  • Russia faces fund exodus as sanctions prompt changes in bond, equity indices South China Morning Post
  • ADX announces the results of its first index review for the FTSE ADX ... ZAWYA
  • 30 years to reach gender equality in senior management Aviva plc
  • Lufax Joins FTSE ESG Low Carbon Select Indexes PR Newswire
  • The Popular Stock Metric That Can Lead Investors Astray HBS Working Knowledge
  • Creating Protections for Index Investing Center for American Progress

    Bloomberg Indices

  • Russia's Exit from Bond Indexes to Trigger Portfolio Rebalancing Bloomberg.com
  • Russian Stocks, Bonds Face Rising Risk of Ejection From Indexes Yahoo Finance
  • Russian stocks and bonds face growing risk of being pushed out of ... Bollyinside
  • Vanguard, Northern Trust ESG Funds Added Russia Bets Before War Bloomberg Quint
  • COMPASS LAUNCHES FUNDAMENTAL DEFI INDEX AS INSTITUTIONAL DEMAND IN DIGITAL ASSETS CONTINUES TO SOAR Yahoo Finance
  • How rich are Russia's oligarchs? Quartz
  • The 'Deltacron' Variant — Something To Worry About, Or Just A ... Kaiser Health News
  • What is ESG Investing? MSCI Ratings Focus on Corporate Bottom ... Bloomberg.com
  • Connecting Beijing's Global Infrastructure: The PEACE Cable in the ... Middle East Institute

    Dow Jones

  • When Performance Matters, Turn to Equal Weighting ETF Trends
  • It’s IRA Season – Ensure Your Assets Are Optimally Invested Kiplinger
  • TortoiseEcofin Announces Index Updates for First Quarter 2022 Digital Journal
  • 'With volatility typically comes opportunity.' These are the smart moves advisors are telling clients to consider now CNBC
  • TortoiseEcofin Announces Constituent Changes Due to Corporate ... StreetInsider.com
  • At CAGR of 8.97% Globally Business-to-Consumer (B2C) E-commerce Market | 2022 - 2028 | Size & Share to Surpass USD 6.38 Trillion by 2028: Industry Trends, Forecast Exclusive Insight Report by Vantage Market Research Yahoo Finance
  • Barge Transportation Market Size [2022-2028] | Industry Size, Share, Growth & Forecast Analysis Yahoo Finance
  • ESG In Credit Ratings Newsletter, February 2022 S&P Global
  • Dental Biomaterials Market size worth $ 12.47 Billion, Globally, by 2028 at 7.29% CAGR: Verified Market Research® Yahoo Finance

    Moex Indexes

  • Ukraine war news from February 25: Kyiv suburbs breached ... Financial Times
  • Stock market news today: Big losses reversed after Russia attacks Ukraine Markets Insider
  • Nasdaq plunges 3% into bear-market territory after Russia launches attack against Ukraine Business Insider Africa
  • Russia warns gas prices will double after Nord Stream 2 blocked The Telegraph
  • Stock markets and bitcoin fall amid Ukraine worries and US interest rate rise fears – as it happened The Guardian
  • Global stocks hit 3-week lows amid Russia-Ukraine tensions TechStory
  • Permian Basin Update, February 24, 2022 – Peak Oil Barrel Peak Oil Barrel
  • Contagion in Global Stock Markets during the COVID?19 Crisis Wiley Online Library
  • In 2021, The Russian Economy Survived The Crisis, But Russians ... MEMRI

    Index Futures Trading

  • Stock Market Today: Dow, S&P Live Updates for Mar. 14, 2022 Bloomberg.com
  • Hong Kong's Hang Seng index drops about 5% as investors monitor China's Covid wave CNBC
  • Shares gain as oil slips on hopes for Ukraine progress Reuters
  • 'Huge' Potential for ESG Futures Markets Media
  • A Peek Into The Markets: US Stock Futures Higher; Crude Oil Rises 2% - Benzinga Benzinga
  • A Peek Into The Markets: US Stock Futures Down; Inflation Data In Focus - Benzinga Benzinga
  • Timeline of US Stock Market Crashes Investopedia
  • U.S. stocks close lower as investors monitor commodity surge, Russia-Ukraine war and the impact on Fed policy MarketWatch
  • Hong Kong's Hang Seng index drops about 5% as investors monitor China's Covid wave CNBC
  • Hang Seng slumps over 5% over COVID lockdown worries, oil falls as Russian attacks in Ukraine intensify MarketWatch
  • Hong Kong shares dive 5.4% as China shuts down Shenzhen KDVR
  • Japan's Nikkei falls 2% as shares in Asia decline; Chinese tech stocks in Hong Kong drop CNBC
  • European Open Futures turn higher 7200 remains in focus for FTSE ... City Index
  • European Stock Futures Higher; Diplomacy Hopes, Central Bank ... Investing.com
  • Oil Prices Fall; Stocks Futures Rise Wall Street Journal
  • Live Chinese shares plunge as Shenzhen goes into lockdown – live ... The Telegraph
  • Stock Market Today: Dow, S&P Live Updates for Feb. 24, 2022 Bloomberg.com
  • Why Emerging Market Stocks Are Far From a Sure Thing Barron's
  • A New Generation of Masters of the Universe Bloomberg.com
  • U.S. Futures Rise as Putin Remark Boosts Sentiment: Markets Wrap Financial Post
  • Stock Market Today: Dow, S&P Live Updates for Mar. 14, 2022 Bloomberg.com
  • Dow Jones Futures Rise: Market Rally Nears Lows Amid Ukraine ... Investor's Business Daily
  • Dow Jones Futures Fall After 'Ideal' Market Action; Inflation Report Due Investor's Business Daily
  • Dow books fifth straight week of losses as Biden says allies trying to avoid World War III MarketWatch
  • Ruble Reopens With a Slump as Traders Price Increased Isolation Yahoo Finance
  • Russia's Stock Exchange Suffers Historic Collapse After Ukraine Invasion Newsweek
  • Russian Stocks Dive 50% As Moscow Exchange Resumes Trading Amid Ukraine Crisis NDTV.com
  • U.S. Stocks Rally to Finish Turbulent Week Wall Street Journal

    Top 20 Index Longs Based on Momentum

    MLIndexnameweek1monthytd6months1yrRank
    WIBO6M IndexPoland Warsaw Interbank RatesGPW Benchmark WIBID/WIBOR PLN1.3420.7737.962420.002420.00999.99
    US0012M IndexICE Benchmark AdministrationICE LIBOR USD 12 Month-4.2361.02120.51446.29350.39213.37
    NTCS11LV IndexTokyo Commodity ExchangeNikkei-JPX LV Cr Oil0.8917.7536.9782.06136.8759.39
    TTENAR IndexStandard & Poor'sS&P/TSX CAP ENERGY TR IX-1.605.9519.5265.8278.3737.14
    SOLGLOIN IndexSolactive (Structured SolutionSolactive Gl Oil Eq NR0.068.0519.5960.7473.6135.62
    BCOMNG3T IndexBloombergBBG Nat Gas 3 M Fwd TR4.8517.6226.2935.0981.6334.80
    RIEHNGTR IndexCQGRICI Enh Natural Gas TR5.0218.0225.8737.2975.9834.08
    BCOMRB IndexBloombergBBG Unleaded Gasoline4.3114.6125.8243.9368.5132.84
    BCOMCO IndexBloombergBBG Brent Crude5.3911.3925.5345.3166.3432.11
    DWETR IndexNew York Stock Exchange (NYSE)Dyn En E&P Intellidex TR-0.518.9419.5651.7668.0632.06
    BCOMPE IndexBloombergBBG Petroleum4.9412.3527.1645.8664.5631.93
    CTWCER3M IndexCMCI WTI $ Ex Ret 3M5.1110.8324.9744.6466.5031.77
    BCOMHO IndexBloombergBBG Heat Oil4.1212.8128.8945.8063.2431.49
    BCOMCL IndexBloombergBBG WTI Crude Oil5.0212.4827.8945.9162.5131.48
    BCOMEN3T IndexBloombergBBG Energy 3 M Fwd TR4.7311.6423.0939.3768.4531.05
    BCOMCL3T IndexBloombergBBG WTI Crd Oil 3M F TR5.129.6923.0142.5265.8130.79
    CTNGTR IndexBloombergCMCI Nat Gas USD Tot Ret4.5217.7225.2727.7668.6629.67
    XTXBCT IndexCMCI RBOB Gas Hdg CHF TR5.4112.3022.9239.9760.7629.61
    SPOILH IndexStandard & Poor'sS&P 500 Oil-hedged-2.436.0511.6135.7277.5829.23
    RIEHCLTR IndexCQGRICI Enh WTI Crd Oil TR5.028.9721.4440.6061.9229.13

    Top 20 Index Shorts Based on Momentum

    MLIndexnameweek1monthytd6months1yrRank
    MXAAR IndexMSCIMSCI All Argentina Pr$-15.70-6.81-24.42-40.65-36.38-24.88
    RTSI$ IndexRTS ExchangeRTS Index-24.93-19.79-29.53-31.22-22.73-24.67
    NTCS11IV IndexTokyo Commodity ExchangeNikkei-JPX IV Cr Oil0.25-10.19-15.58-36.20-52.08-24.56
    MXRU IndexMSCIMSCI RUSSIA-25.05-19.34-28.78-30.11-21.31-23.95
    DJRUSGD IndexStandard & Poor'sDJ Russia GDR $-26.67-20.55-30.28-27.43-18.19-23.21
    NCL9000X IndexNASDAQ OMXNASDAQ OMX CHN Tech TR-5.51-8.98-11.04-22.82-50.62-21.98
    HXCX IndexNASDAQ Global MarketGolden Dragon China TR-4.93-1.09-5.90-24.23-57.10-21.84
    DJRUSGR IndexStandard & Poor'sDJ Russia GDR T$-26.79-20.69-29.86-25.88-13.78-21.79
    NETX IndexNASDAQ Global MarketNASDAQ CTA Internet Total Rt-7.66-7.54-21.81-32.57-32.58-20.09
    SUNIDX IndexDow JonesMACGlbSolarEgyTR-4.63-3.44-19.34-28.68-40.31-19.27
    DXRN IndexDeutsche BoerseDAXgbl Russia EUR NR-22.29-16.23-24.61-23.47-14.35-19.08
    MXCN00SG IndexMSCIMSCI China SC Growth-2.37-7.03-10.36-24.25-41.71-18.84
    RGUSHS IndexRussellR2 Health Care-6.07-0.03-19.02-29.30-39.74-18.79
    M1EF0CD IndexMSCIMSCI EM/CONSUMER D NR-3.55-8.19-6.53-18.43-40.87-17.76
    DJICHK IndexDow JonesDJIM ChinaHK Ind-5.61-11.94-10.93-18.27-34.70-17.63
    DZCTR IndexNew York Stock Exchange (NYSE)Dyn Sftwr Intellidex TR-8.660.58-16.86-25.86-35.18-17.28
    MSRC30NU IndexMSCIMSCI Russia 30% Capped T-19.22-13.07-22.93-23.20-10.60-16.52
    MSEURC$N IndexMSCIMSCI Russia Capped at Gr-19.22-13.07-22.93-23.20-10.60-16.52
    TFBRICU IndexFTSEFTSE BRIC 50 INDEX TRI $-6.99-8.87-5.72-14.39-35.43-16.42
    LEVDAX3 IndexDeutsche BoerseLevDAX x3 AR (TR) EUR-16.14-20.10-24.37-27.61-0.82-16.17

    Best Indexes last Week

    MLIndexnameyesterdayytdweek1month6months1yrRank
    SHRTDX3 Index Deutsche BoerseShortDAX x3 TR EUR3.4124.8817.5419.0911.22-30.904.24
    SHRTDAX2 Index Deutsche BoerseSHORTDAX X2 INDEX2.2316.6911.3312.777.49-21.932.42
    SMISL Index Six Swiss ExchangeSMI Daily Short Leverage1.6617.217.778.026.86-28.70-1.51
    XTLNCT Index BloombergCMCI Nickel Hdg CHF TR3.4018.117.732.3131.2821.8015.78
    BCOMNI Index BloombergBBG Nickel3.1121.076.964.2934.6829.2018.78
    CACDSH Index EuronextCAC 40 DOUBLE SHORT GR1.419.506.788.21-11.55-40.46-9.25
    KRXSHIP Index KOSPI Stock MarketKRX Machinery & Equip-1.00-12.156.56-6.69-17.08-5.47-5.67
    GDMNTR Index New York Stock Exchange (NYSE)NYSE Arca Gold MinersNTR0.418.326.488.9511.913.627.74
    XTLNET Index CMCI Nickel Hdg EUR TR3.0718.376.482.8426.5816.5813.12
    XTPLGT Index BloombergCMCI Platinum Hdg GBP0.4712.246.434.649.44-19.870.16
    TMECSUB6 Index Osaka Securities ExchangeTMECSUB61.6512.126.334.5510.00-16.171.18
    XTWWCT Index BloombergCMCI Wheat Hdg CHF TR3.256.526.295.1710.4019.1810.26
    MUTFPLAT Index MUFG BankMUFG Commodity Platinum1.6412.656.274.8210.34-15.891.38
    IBEXDS Index Madrid Stock ExchangeIBEX 35 Double Short0.984.406.194.64-0.29-24.97-3.61
    CTPLTR Index CMCI Plat NYM $ Tot Ret0.5312.116.094.6110.95-16.131.38
    BCOMBO Index BloombergBBG Soybean Oil3.0923.246.0710.5816.0563.9924.17
    UKXI3X Index FTSEFTSE 100 UKXI3X0.62-4.805.90-0.09-20.07-44.98-14.81
    XTWCCT Index CMCI WTI Crud Hdg CHF TR4.3621.095.818.6239.3856.3227.53
    XTPLET Index BloombergCMCI Platinum Hdg EUR TR0.4911.195.684.216.23-22.97-1.71
    XTNGCT Index CMCI NGas NYM Hdg CHF TR2.2424.105.6416.7627.0862.6528.03

    Worst Indexes last Week

    MLIndexnameyesterdayytdweek1month6months1yrRank
    DJRUSGR Index Standard & Poor'sDJ Russia GDR T$-8.89-29.86-26.79-20.69-25.88-13.78-21.79
    DJRUSGD Index Standard & Poor'sDJ Russia GDR $-8.90-30.28-26.67-20.55-27.43-18.19-23.21
    MXRU Index MSCIMSCI RUSSIA-7.21-28.78-25.05-19.34-30.11-21.31-23.95
    RTSI$ Index RTS ExchangeRTS Index-6.88-29.53-24.93-19.79-31.22-22.73-24.67
    DXRN Index Deutsche BoerseDAXgbl Russia EUR NR-7.05-24.61-22.29-16.23-23.47-14.35-19.08
    LEVDAX3 Index Deutsche BoerseLevDAX x3 AR (TR) EUR-3.67-24.37-16.14-20.10-27.61-0.82-16.17
    LEVDAX Index Deutsche BoerseLevDAX Index-2.49-16.44-11.11-13.53-19.23-0.64-11.13
    D1AJ Index Deutsche BoerseLevDAX Index-2.49-16.49-11.10-13.53-19.23-0.64-11.13
    FMIBL2X Index FTSEFTSE MIB FMIBL2X-2.08-11.06-8.81-9.29-3.1919.85-0.36
    EUETMP Index STOXXSTX EUEnlrg TM (EUR) Pr-1.88-6.93-7.56-8.05-9.662.66-5.65
    MCXL2X Index FTSEFTSE 250 MCXL2X-1.23-19.92-7.34-11.02-23.54-1.53-10.86
    CACLV Index BloombergCAC 40 Leverage Index-1.67-12.30-7.18-9.77-2.9024.571.18
    CACGL Index NYSE Euronext AmsterdamCAC 40 Leverage GR-1.67-12.10-7.17-9.76-1.9530.432.89
    CACTL Index Euronext ParisCAC 40 LEVERAGE NR-1.67-12.15-7.17-9.76-2.2028.862.43
    DEDZ7 Index SX5E Dividend Fut Dec27-1.59-1.68-7.07-2.13-0.809.84-0.04
    TFBRICU Index FTSEFTSE BRIC 50 INDEX TRI $-2.46-5.72-6.99-8.87-14.39-35.43-16.42
    DEDZ5 Index SX5E Dividend Fut Dec25-2.22-1.44-6.90-2.990.4710.580.29
    DEDZ6 Index SX5E Dividend Fut Dec26-1.74-1.55-6.78-2.61-0.0210.380.24
    IBXQ Index Madrid Stock ExchangeIBEX 35 Double Lev Net-1.22-5.89-6.56-6.29-13.022.58-5.82
    SXTR Index STOXXSTXE 600 Tr&Ls (EUR) NRt0.36-4.63-6.32-5.23-16.53-18.01-11.52

    Best Indexes last Month

    MLIndexnameyesterdayytdweek1month6months1yrRank
    MUTFPALL Index MUFG BankMUFG Commodity Palladium-0.0521.140.6819.51-3.581.574.55
    SHRTDX3 Index Deutsche BoerseShortDAX x3 TR EUR3.4124.8817.5419.0911.22-30.904.24
    BCOMNG Index BloombergBBG Natural Gas1.8925.794.9818.224.0837.6916.24
    RIEHNGTR Index CQGRICI Enh Natural Gas TR1.9525.875.0218.0237.2975.9834.08
    XTNGGT Index BloombergCMCI Natgas Hdg GBP TR1.8925.614.8617.8826.2662.0727.77
    NTCS11LV Index Tokyo Commodity ExchangeNikkei-JPX LV Cr Oil7.5036.970.8917.7582.06136.8759.39
    CTNGTR Index BloombergCMCI Nat Gas USD Tot Ret1.9225.274.5217.7227.7668.6629.67
    BCOMNG3T Index BloombergBBG Nat Gas 3 M Fwd TR1.7226.294.8517.6235.0981.6334.80
    XTNGET Index BloombergCMCI NGas NYM Hdg EUR TR1.9124.434.3917.4522.4655.6524.99
    XTNGCT Index CMCI NGas NYM Hdg CHF TR2.2424.105.6416.7627.0862.6528.03
    BCOMSY Index BloombergBBG Soybeans1.6521.454.7715.0520.8224.0716.18
    BCOMRB Index BloombergBBG Unleaded Gasoline4.0125.824.3114.6143.9368.5132.84
    XTSYET Index BloombergCMCI Soybean Hdg EUR TR1.4318.703.8413.3514.7321.3113.31
    BCOMHO Index BloombergBBG Heat Oil3.8428.894.1212.8145.8063.2431.49
    SHRTDAX2 Index Deutsche BoerseSHORTDAX X2 INDEX2.2316.6911.3312.777.49-21.932.42
    XTSYCT Index BloombergCMCI Soybean Hdg CHF TR1.7718.435.0912.7419.0126.8015.91
    BCOMCL Index BloombergBBG WTI Crude Oil4.7227.895.0212.4845.9162.5131.48
    BCOMPE Index BloombergBBG Petroleum4.6327.164.9412.3545.8664.5631.93
    XTXBCT Index CMCI RBOB Gas Hdg CHF TR4.2222.925.4112.3039.9760.7629.61
    EUCRBRDT Index BloombergEuropean Crude Dated Brent Spo0.9927.393.1711.9140.8452.5627.12

    Worst Indexes last Month

    MLIndexnameyesterdayytdweek1month6months1yrRank
    MUTFPALL Index MUFG BankMUFG Commodity Palladium-0.0521.140.6819.51-3.581.574.55
    SHRTDX3 Index Deutsche BoerseShortDAX x3 TR EUR3.4124.8817.5419.0911.22-30.904.24
    BCOMNG Index BloombergBBG Natural Gas1.8925.794.9818.224.0837.6916.24
    RIEHNGTR Index CQGRICI Enh Natural Gas TR1.9525.875.0218.0237.2975.9834.08
    XTNGGT Index BloombergCMCI Natgas Hdg GBP TR1.8925.614.8617.8826.2662.0727.77
    NTCS11LV Index Tokyo Commodity ExchangeNikkei-JPX LV Cr Oil7.5036.970.8917.7582.06136.8759.39
    CTNGTR Index BloombergCMCI Nat Gas USD Tot Ret1.9225.274.5217.7227.7668.6629.67
    BCOMNG3T Index BloombergBBG Nat Gas 3 M Fwd TR1.7226.294.8517.6235.0981.6334.80
    XTNGET Index BloombergCMCI NGas NYM Hdg EUR TR1.9124.434.3917.4522.4655.6524.99
    XTNGCT Index CMCI NGas NYM Hdg CHF TR2.2424.105.6416.7627.0862.6528.03
    BCOMSY Index BloombergBBG Soybeans1.6521.454.7715.0520.8224.0716.18
    BCOMRB Index BloombergBBG Unleaded Gasoline4.0125.824.3114.6143.9368.5132.84
    XTSYET Index BloombergCMCI Soybean Hdg EUR TR1.4318.703.8413.3514.7321.3113.31
    BCOMHO Index BloombergBBG Heat Oil3.8428.894.1212.8145.8063.2431.49
    SHRTDAX2 Index Deutsche BoerseSHORTDAX X2 INDEX2.2316.6911.3312.777.49-21.932.42
    XTSYCT Index BloombergCMCI Soybean Hdg CHF TR1.7718.435.0912.7419.0126.8015.91
    BCOMCL Index BloombergBBG WTI Crude Oil4.7227.895.0212.4845.9162.5131.48
    BCOMPE Index BloombergBBG Petroleum4.6327.164.9412.3545.8664.5631.93
    XTXBCT Index CMCI RBOB Gas Hdg CHF TR4.2222.925.4112.3039.9760.7629.61
    EUCRBRDT Index BloombergEuropean Crude Dated Brent Spo0.9927.393.1711.9140.8452.5627.12

    Best Indexes YTD

    MLIndexnameyesterdayytdweek1month6months1yrRank
    NTCS11LV Index Tokyo Commodity ExchangeNikkei-JPX LV Cr Oil7.5036.970.8917.7582.06136.8759.39
    BCOMHO Index BloombergBBG Heat Oil3.8428.894.1212.8145.8063.2431.49
    BCOMCL Index BloombergBBG WTI Crude Oil4.7227.895.0212.4845.9162.5131.48
    EUCRBRDT Index BloombergEuropean Crude Dated Brent Spo0.9927.393.1711.9140.8452.5627.12
    BCOMPE Index BloombergBBG Petroleum4.6327.164.9412.3545.8664.5631.93
    BCOMNG3T Index BloombergBBG Nat Gas 3 M Fwd TR1.7226.294.8517.6235.0981.6334.80
    RIEHNGTR Index CQGRICI Enh Natural Gas TR1.9525.875.0218.0237.2975.9834.08
    BCOMRB Index BloombergBBG Unleaded Gasoline4.0125.824.3114.6143.9368.5132.84
    BCOMNG Index BloombergBBG Natural Gas1.8925.794.9818.224.0837.6916.24
    XTNGGT Index BloombergCMCI Natgas Hdg GBP TR1.8925.614.8617.8826.2662.0727.77
    BCOMCO Index BloombergBBG Brent Crude5.0625.535.3911.3945.3166.3432.11
    CTNGTR Index BloombergCMCI Nat Gas USD Tot Ret1.9225.274.5217.7227.7668.6629.67
    CTWCER3M Index CMCI WTI $ Ex Ret 3M4.4724.975.1110.8344.6466.5031.77
    SHRTDX3 Index Deutsche BoerseShortDAX x3 TR EUR3.4124.8817.5419.0911.22-30.904.24
    XTNGET Index BloombergCMCI NGas NYM Hdg EUR TR1.9124.434.3917.4522.4655.6524.99
    XTNGCT Index CMCI NGas NYM Hdg CHF TR2.2424.105.6416.7627.0862.6528.03
    BCOMBO Index BloombergBBG Soybean Oil3.0923.246.0710.5816.0563.9924.17
    BCOMEN3T Index BloombergBBG Energy 3 M Fwd TR3.3823.094.7311.6439.3768.4531.05
    BCOMCL3T Index BloombergBBG WTI Crd Oil 3M F TR4.4823.015.129.6942.5265.8130.79
    XTXBCT Index CMCI RBOB Gas Hdg CHF TR4.2222.925.4112.3039.9760.7629.61

    Worst Indexes YTD

    MLIndexnameyesterdayytdweek1month6months1yrRank
    DJRUSGD Index Standard & Poor'sDJ Russia GDR $-8.90-30.28-26.67-20.55-27.43-18.19-23.21
    DJRUSGR Index Standard & Poor'sDJ Russia GDR T$-8.89-29.86-26.79-20.69-25.88-13.78-21.79
    RTSI$ Index RTS ExchangeRTS Index-6.88-29.53-24.93-19.79-31.22-22.73-24.67
    MXRU Index MSCIMSCI RUSSIA-7.21-28.78-25.05-19.34-30.11-21.31-23.95
    DXRN Index Deutsche BoerseDAXgbl Russia EUR NR-7.05-24.61-22.29-16.23-23.47-14.35-19.08
    LEVDAX3 Index Deutsche BoerseLevDAX x3 AR (TR) EUR-3.67-24.37-16.14-20.10-27.61-0.82-16.17
    SX8R Index STOXXSTXE 600 Tech (EUR) NRt-0.64-20.90-5.93-13.86-21.78-9.49-12.77
    MCXL2X Index FTSEFTSE 250 MCXL2X-1.23-19.92-7.34-11.02-23.54-1.53-10.86
    SUNIDX Index Dow JonesMACGlbSolarEgyTR-0.77-19.34-4.63-3.44-28.68-40.31-19.27
    WAEXC Index Solactive (Structured SolutionWldAltEngyCW-TR-0.08-17.20-4.65-3.79-18.04-15.11-10.40
    SMILEP Index Six Swiss ExchangeSMI Daily Leverage Price-2.21-16.94-5.69-10.02-10.3517.37-2.17
    D1AJ Index Deutsche BoerseLevDAX Index-2.49-16.49-11.10-13.53-19.23-0.64-11.13
    LEVDAX Index Deutsche BoerseLevDAX Index-2.49-16.44-11.11-13.53-19.23-0.64-11.13
    KOSPI2LG Index KOSPI Stock MarketKOSPI200 Leverage IDX-2.61-15.692.03-7.12-24.52-31.58-15.30
    NTCS11IV Index Tokyo Commodity ExchangeNikkei-JPX IV Cr Oil-3.84-15.580.25-10.19-36.20-52.08-24.56
    VBCEUN Index NASDAQ OMXVINX Bench Cap EUR NI-0.20-15.19-5.55-7.46-15.56-1.50-7.52
    AGIXLT Index New York Stock Exchange (NYSE)Alerian Glbl XL TR-0.42-14.98-3.99-5.58-10.44-14.37-8.59
    DK5G Index STOXXSTX Nd 30 (EUR) NRt-0.19-14.90-5.45-7.42-15.59-3.40-7.97
    SXNR Index STOXXSTXE 600 Ig&S (EUR) NRt-0.67-13.97-5.20-7.60-14.13-2.49-7.36
    SXRR Index STOXXSTXE 600 Rtl (EUR) NRt-0.64-13.41-3.49-8.69-17.23-8.28-9.42

    Best Indexes 1yr

    MLIndexnameyesterdayytdweek1month6months1yrRank
    NTCS11LV Index Tokyo Commodity ExchangeNikkei-JPX LV Cr Oil7.5036.970.8917.7582.06136.8759.39
    BCOMNG3T Index BloombergBBG Nat Gas 3 M Fwd TR1.7226.294.8517.6235.0981.6334.80
    RIEHNGTR Index CQGRICI Enh Natural Gas TR1.9525.875.0218.0237.2975.9834.08
    SOLGLOIN Index Solactive (Structured SolutionSolactive Gl Oil Eq NR0.3619.590.068.0560.7473.6135.62
    CTNGTR Index BloombergCMCI Nat Gas USD Tot Ret1.9225.274.5217.7227.7668.6629.67
    BCOMRB Index BloombergBBG Unleaded Gasoline4.0125.824.3114.6143.9368.5132.84
    BCOMEN3T Index BloombergBBG Energy 3 M Fwd TR3.3823.094.7311.6439.3768.4531.05
    CTWCER3M Index CMCI WTI $ Ex Ret 3M4.4724.975.1110.8344.6466.5031.77
    BCOMCO Index BloombergBBG Brent Crude5.0625.535.3911.3945.3166.3432.11
    BCOMCL3T Index BloombergBBG WTI Crd Oil 3M F TR4.4823.015.129.6942.5265.8130.79
    BCOMPE Index BloombergBBG Petroleum4.6327.164.9412.3545.8664.5631.93
    XTKCCT Index CMCI Coffee Hdg CHF TR0.337.35-1.252.0727.0364.4123.06
    BCOMBO Index BloombergBBG Soybean Oil3.0923.246.0710.5816.0563.9924.17
    BCOMHO Index BloombergBBG Heat Oil3.8428.894.1212.8145.8063.2431.49
    XTNGCT Index CMCI NGas NYM Hdg CHF TR2.2424.105.6416.7627.0862.6528.03
    BCOMCL Index BloombergBBG WTI Crude Oil4.7227.895.0212.4845.9162.5131.48
    XTNGGT Index BloombergCMCI Natgas Hdg GBP TR1.8925.614.8617.8826.2662.0727.77
    RIEHCLTR Index CQGRICI Enh WTI Crd Oil TR4.0621.445.028.9740.6061.9229.13
    CTWCTR Index BloombergCMCI WTI USD Tot Ret4.0322.164.929.5539.6761.7428.97
    CTWCER Index BloombergCMCI WTI USD Ex Ret4.0322.124.919.5239.6061.6328.92

    Worst Indexes 1yr

    MLIndexnameyesterdayytdweek1month6months1yrRank
    NTCS11IV Index Tokyo Commodity ExchangeNikkei-JPX IV Cr Oil-3.84-15.580.25-10.19-36.20-52.08-24.56
    NCL9000X Index NASDAQ OMXNASDAQ OMX CHN Tech TR-1.46-11.04-5.51-8.98-22.82-50.62-21.98
    UKXI3X Index FTSEFTSE 100 UKXI3X0.62-4.805.90-0.09-20.07-44.98-14.81
    CACDSH Index EuronextCAC 40 DOUBLE SHORT GR1.419.506.788.21-11.55-40.46-9.25
    SUNIDX Index Dow JonesMACGlbSolarEgyTR-0.77-19.34-4.63-3.44-28.68-40.31-19.27
    TFBRICU Index FTSEFTSE BRIC 50 INDEX TRI $-2.46-5.72-6.99-8.87-14.39-35.43-16.42
    DJICHK Index Dow JonesDJIM ChinaHK Ind-2.69-10.93-5.61-11.94-18.27-34.70-17.63
    XU100 Index Istanbul Stock ExchangeBIST 100 INDEX-2.503.61-2.73-2.68-15.85-34.10-13.84
    UKXI2X Index FTSEFTSE 100 UKXI2X0.33-2.834.030.21-13.44-32.62-10.45
    KOSPI2LG Index KOSPI Stock MarketKOSPI200 Leverage IDX-2.61-15.692.03-7.12-24.52-31.58-15.30
    XIN0I Index FTSEFTSE China 50 Index HKD-2.30-2.33-3.63-8.37-9.14-31.44-13.15
    SHRTDX3 Index Deutsche BoerseShortDAX x3 TR EUR3.4124.8817.5419.0911.22-30.904.24
    KSP2EC Index KOSPI Stock MarketKOSPI200 Eng&Chem-2.55-11.400.96-11.03-20.42-28.87-14.84
    SMISL Index Six Swiss ExchangeSMI Daily Short Leverage1.6617.217.778.026.86-28.70-1.51
    TR20I Index Dow JonesDJ TURKEY TITANS 20-1.937.54-2.49-1.20-12.70-27.05-10.86
    KRXENCM Index KOSPI Stock MarketKRX ENERGY & CHEM INDX-2.52-13.320.98-12.02-19.24-26.44-14.18
    IBEXDS Index Madrid Stock ExchangeIBEX 35 Double Short0.984.406.194.64-0.29-24.97-3.61
    TR20DT Index Dow JonesDJ TU Ttns20 T$-1.957.90-2.50-1.34-12.13-24.53-10.13
    XTPLET Index BloombergCMCI Platinum Hdg EUR TR0.4911.195.684.216.23-22.97-1.71
    FMIBI1X Index FTSEFTSE MIB FMIBI1X0.854.754.093.61-7.29-22.90-5.62

    Latest ML Comics

    Rob is penetrating wrestling craft
    Rob is penetrating consumer discretionary sector
    Rob is penetrating consumer discretionary sector
    Markets have been rising on fears of attack on North Korea, then they were rising as the threat of North Korea risk off was less. After some huff and puff - Rob decided to try and raise some money for his future automotive engineering business.
    Initial Team
    4 Wheel drive and thoughts about business
    Rear Engine Transmission Shift Problem
    6 Wheeler in the Making
    Rob has a new plan

    Recent ML Rural Highlights. Small Towns and Villages

    Vaskoh-Romania
    Artvin-Turkey
    Gorishkino-Russia
  • Midlincoln deurbanisation enterprise intitiative

    This section contains links to materials about Midlincoln deurbanisation enterprise intitiative.

    Midlincoln is testing rural co-working model as its core business. Half of the co-working space is dedicated to investment analytics service and half of the space is industrial, creative environment with machines and tools which can be used in product development and small scale production. Our deurbanisation enterprise intitiative includes the following ideas:

    Midlincoln Research
    Financials

    Investment Research

    View Midlincoln Research One Pager

    Mount Maple
    Souvenirs
    Cons. Cyclicals

    Consumer Cyclicals

    View the souvenir producer one pager

    Midlincoln
    Craft Fund

    Midlincoln Craft Fund

    View Midlincoln Craft Fund Description

    TamaraAvia
    Automotive

    Engineering

    View intro for this automotive producer

    Wrestling, Healthcare and
    Entertainment

    ITI RTS ETF Report

    Read about wrestling craft business

    Village Telecoms
    and Media

    Telecoms

    Coming up and not ready yet

    Small Scale
    Energy

    Energy

    Coming up and not ready yet

    Small Scale
    Materials

    Materials

    Coming up and not ready yet

    Verical Agri
    and Food Production

    Consumer Staples

    Coming up and not ready yet

    Heating, Water, Electrics
    Installation and Repair

    Utilities

    Coming up and not ready yet

    Home Electronics
    Repair

    technology

    Coming up and not ready yet

    Russian Macro
    and
    RTS vs. MSCI and RSX

    ITI RTS ETF Report

    View Russian Macro and RTS vs. MSCI Report

    Russian
    Domestic
    Liquidity

    RTS Future vs. ETF

    View Russian Domestic Liquidity Report

    ETFs on Moex
    and
    Abroad

    RTS Future vs. ETF

    View Russian ETF Industry Report

    ITI Russian Eurobonds ETF

    ITI Bonds ETF Report

    View ITI Bonds ETF Report

    ITI Funds
    RTS Index
    ETF

    ITI RTS ETF Report

    View ITI RTS ETF Report

    RTS Futures
    vs
    RTS ETF

    RTS Future vs. ETF

    View Futures match price, and not TR Report