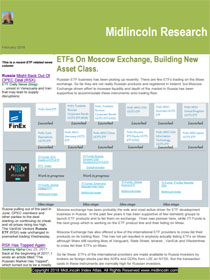
image
Midlincoln Index Atlas October 25, 2021
If your are viewing this document on a mobile device click here to skip part with data and go directly to content part

Top 20 Long Index Ideas YTD From Best to Worst

objectiveYTD
ENERGY52.90
MIDDLE EAST REGION33.23
RUSSIA31.96
FRANCE26.89
ENERGY SECTOR26.33
INDIA23.31
GCC22.48
AGRICULTURE21.21
NETHERLANDS21.09
NORWAY18.84
FINANCIAL18.73
NATURAL RESOURCES SECTOR18.71
VALUE MID CAP18.40
EASTERN EUROPEAN REGION17.78
CANADA16.99
EQUITY HEDGE DIVERSIFIED16.80
PREFERRED16.62
TARGET 2041-204516.62
FINANCIAL SECTOR16.26
IRELAND16.13

Top 20 Short Index Ideas YTD From Best to Worst

objectiveYTD
PERU-23.74
TURKEY-19.87
CHILE-10.09
KOREA-10.05
CHINA-8.61
HONG KONG-8.06
BRAZIL-7.51
PRECIOUS METAL SECTOR-6.91
PRECIOUS METALS-6.69
GREATER CHINA-6.28
EVENT DRIVEN SPECIAL SITUATION-5.80
FIXED INCOME ARBITRAGE-5.80
FOREIGN A00001106GGREGATE BOND-5.49
PHILIPPINES-4.84
COLOMBIA-4.36
SPAIN-4.31
BRIC-4.09
GOVERNMENT INTERMEDIATE-3.84
LONG TERM CORPORATE BOND-3.36
D0A3YNAMIC ALLOCATION-3.17

Combined Performance of Tracked Indexes by Index Provider Top 20 Winners

sourcenameytd
Tokyo Commodity Exchange56.755
Poland Warsaw Interbank Rates53.33
CQG51.08
Market Vectors Index Solutions44.87
Teucrium42.1
Diapason Commodities39.88
Zacks37
WisdomTree36.48
Cushing35.81
Saudi Arabian Stock Exchange33.23
Colombo Stock Exchange31.87
RTS Exchange31.7
Stuttgart Stock Exchange29.485
NYSE AMEX28.3675
Prague Stock Exchange27.11
Bermuda Stock Exchange25.82
National Stock Exchange of Ind25.72
NYSE Euronext Amsterdam24.564999999999998
BSE India24.38
Bulgaria Stock Exchange20.22

Combined Performance of Tracked Indexes by Index Provider Top 20 Losers

sourcenameytd
Istanbul Stock Exchange-22.19
NASDAQ OMX PSX-17.33
Bolsa de Comercio de Santiago-16.64
Thai Bond Market Association-16.48
ICE Benchmark Administration-15.433333333333332
London Bullion Market Associat-15.1
BOVESPA-14.91
London Metal Exchange - LME-14.725000000000001
Government Debt Management Age-10.32
China Securities Index Co., Lt-8.32
Gold Traders Association of Th-7.62
iBoxx-6.859999999999999
Madrid Stock Exchange-6.6475
Shanghai Gold Exchange Contrac-5.96
Nikkei-5.96
BM&FBOVESPA-5.3
J.P. Morgan-3.711111111111111
Banco Central do Brasil-3.17
Nigerian Stock Exchange-1.95
Markit-1.2133333333333336

Chart: Index Strategy

October 2021

Source:

Download All Slides in Power Point
  • Direct Indexing Definition Investopedia
  • DSP launches Nifty 50 Equal Weight ETF. 5 things to know Mint
  • NATO Review - An Artificial Intelligence Strategy for NATO NATO
  • Stock picking is as popular as ever despite indexing's proven success — 'Trillions' author on what's driving it CNBC
  • Anil Singhvis Strategy October 25: Day support zone on Nifty is 17,950-18,050 & Bank Nifty is 40,050-40... Zee Business
  • Should you go for India’s first Nifty ETF based on equal weight strategy Mint
  • Following buy and hold strategy? Here's where you should invest The Economic Times
  • This Investor Is Worth $4.5 Million. But If He Could Start Over, He’d Put Everything Into a Target Date Index Fund NextAdvisor

    Key Topics and News

    Index Ideas YTD From Best to Worst
    Top 20 Short Index Ideas YTD From Best to Worst
    Combined Performance of Tracked Indexes by Index Provider Top Winners
    Combined Performance of Tracked Indexes by Index Provider Top Losers

    Recent Index Atlas Ideas ChartArt

    Index Strategy

    Download file in Power Point
    ML Index Strategy

    Download file in Power Point
    Index Strategy

    Download file in Power Point
    Index Strategy

    Download file in Power Point
    Index Strategy

    Download file in Power Point
    Index Strategy

    Download file in Power Point
    Index Strategy

    Download file in Power Point
    Index Strategy

    Download file in Power Point
    Index Strategy

    Download file in Power Point

    Index Rebalancing News

    MSCI

  • MSCI index rejig may result in inflows of $1 bn into India Mint
  • Zomato, IRCTC, Mindtree stocks, others stare at $1 billion inflows after possible entry in MSCI India index The Financial Express
  • Quarterly Index rebalancing to take place today; Edelweiss predicts Wipro’s entry in Sensex and Bajaj Auto’s e CNBC TV18
  • MSCI Index May Get 6 New Stocks; Potential To Attract $1bn The Indian Wire
  • IRCTC soars 20% in a week; analysts see multiple triggers for the stock Business Standard
  • Listed Companies Account for 40% of Climate-warming Emissions ... PR Newswire
  • How To Make Corporate Boards More Diverse Center for American Progress
  • Harmonizing corporate carbon footprints Nature
  • APREA, MSCI launch pan-Asia quarterly property fund index IPE Real Assets

    Standard & Poor's Index

  • Form FWP BANK OF MONTREAL /CAN/ Filed by: BANK OF ... StreetInsider
  • S&P Global Clean Energy Index: A Path Toward Greater Transparency Seeking Alpha
  • Volatile ASX surges as wall of cash hits market The Australian
  • Swan Global Investments “HEGD” ETF is One of the Fastest ... Business Wire
  • Fed internal watchdog to review trading activity Los Angeles Times
  • How To Make Corporate Boards More Diverse Center for American Progress
  • Symptom Persistence Despite Improvement in Cardiopulmonary ... The Lancet
  • S&P 500 ETFs: 7 Ways to Play the Index Kiplinger
  • 2020 Annual Report S&P Global

    Hang Seng

  • HKEX launches first A-share derivatives product in fresh boost for ... Global Times
  • Sensex closes 410 pts lower, Nifty at 17,749; IT, realty top drags; metals gain Mint
  • Hang Seng Index Adopts Overhaul to Hong Kong's Stock Benchmark Bloomberg.com
  • Hang Seng Index posts winning week before benchmark review as Tencent slips South China Morning Post
  • Hang Seng Index revamp dents Tencent, AIA while two new joiners surge South China Morning Post
  • US Commercial Payment Cards Market Future Growth Prospects ... Puck77
  • WRAPUP 3-China's bond markets slump again as new Evergrande deadline passes Devdiscourse
  • Today"s Market View - Adriatic Metals, Anglo Asian Mining, Atalya Mining and more... Proactive Investors
  • Today"s Market View - Thor Explorations, Castillo Copper, BHP and more... Proactive Investors

    FTSE

  • FTSE 100 ends higher as miners rebound Proactive Investors
  • FTSE 100 looks set to end the week on a high note Proactive Investors
  • Norway's $1.4 Trillion Fund Salvages Return With Stock Sales Bloomberg.com
  • FTSE 100 rising strongly as gold shrugs off bitcoin mania Proactive Investors
  • Euronext launches MIB ESG Index | ETF Strategy ETF Strategy
  • IMF chief economist Gopinath to leave fund, return to Harvard Yahoo News UK
  • Lufax Joins FTSE ESG Low Carbon Select Indexes PR Newswire
  • So Many Stocks Are Joining Russell Indexes They Got One Wrong Bloomberg.com
  • REXEL : THIRD-QUARTER 2021 SALES: SOLID PERFORMANCE GlobeNewswire

    Bloomberg Indices

  • Mike Philbrick's Top Picks: October 1, 2021 BNN
  • Stock Index: What It Is & How It Works Seeking Alpha
  • Bloomberg's 'The Agg' Bond Index Is Getting a New Name Barron's
  • Stocks That May Be Added to S&P 500 Index: Match, Keurig, Epam Bloomberg.com
  • Dow, Nasdaq Composite end more than 300 points lower as October selloff deepens on concerns about inflation driven by oil rally MarketWatch
  • Putting Bitcoin Futures in Perspective Nasdaq
  • Beat Private Equity With This Real Estate ETF Nasdaq
  • 5 Things US Policymakers Must Understand About China-Africa ... Center for American Progress
  • Form 424B2 JPMORGAN CHASE & CO Form 424B2 JPMORGAN CHASE & CO

    Dow Jones

  • To buy-and-hold or rebalance? The Hindu
  • Dow falls 320 points to start the week, Nasdaq drops 2% amid tech rout CNBC
  • Understanding The Wilshire 5000 Index Forbes
  • Long dated Treasury yields post biggest quarterly rise since March as inflation worries intensify and global central banks pivot MarketWatch
  • As Wall Street sees a Chinese stock market 'on sale,' others warn 'that game is over' CNBC
  • Pandora Papers: An offshore data tsunami ICIJ
  • Low Voltage Cables Market worth USD 166.2 Billion by 2028, registering a CAGR of 7.41% - Report by Market Research Future (MRFR) Yahoo Finance
  • Farm Animal Genetics Market and Live Animal Genetics Market Size to 2027 By Upcoming Global Trends and Challenges, Industry Revenue, Growth Factors, Future Strategic Planning, Key Vendors, Market Contribution & Developments, Key Challenges Yahoo Finance
  • Enterprise Performance Management Market size worth $ 8.04 Billion, Globally, by 2028 at 6.24% CAGR: Verified Market Research® Yahoo Finance

    Moex Indexes

  • Contagion in Global Stock Markets during the COVID?19 Crisis Wiley Online Library
  • Samolet see EBITDA up by half despite the coronacrisis bne IntelliNews
  • QIWI plc 424B7 Jul. 20, 2020 5:29 PM Seeking Alpha
  • Russlands Aktienmarkt glänzt mit hohen Dividenden Börsen-Zeitung

    Index Futures Trading

  • Stock Market Today: Dow, S&P Live Updates for Oct. 25, 2021 Bloomberg.com
  • Cboe and MSCI plan options growth following partnership extension The Trade
  • Hong Kong's China stock derivatives seen setting trading record Nikkei Asia
  • HKEX launched A-share derivatives product based on MSCI China ... Global Times
  • A Peek Into The Markets: US Stock Futures Mostly Lower Ahead Of Earnings, PMI Data Yahoo Finance
  • A Peek Into The Markets: US Stock Futures Down Ahead Of Earnings, Jobless Claims Data Yahoo Finance
  • A Peek Into The Markets: US Stock Futures Edge Higher; Facebook ... Benzinga
  • A Peek Into The Markets: US Stock Futures Flat Ahead Of Earnings, Fed's Beige Book Report Yahoo Finance
  • Stock Market Today: Dow, S&P Live Updates for Oct. 25, 2021 Bloomberg.com
  • Asia-Pacific stocks mixed as HSBC earnings beat expectations; oil prices rise CNBC
  • Asian markets mixed at start of week MarketPulse
  • Asia stocks mixed after Wall St slips, China travel curbs News4Jax
  • Sensex ends near 61K, Nifty above 18,100; ICICI Bank jumps 12%, Bajaj twins hit Mint
  • European stocks drift higher as investors prepare for deluge of tech ... Financial Times
  • Global Investors Gain a New Way to Bet on Stocks in China The Wall Street Journal
  • European Stock Futures Steady; HSBC Results Impress By Investing ... Investing.com
  • Stock Market Today: Dow, S&P Live Updates for Oct. 4 Bloomberg.com
  • Stock market news live updates: Stocks turn higher as volatile month rolls on Yahoo Finance
  • Bitcoin (BTC) Price Pushes Toward Record as Futures ETF Poised ... Bloomberg.com
  • Stock Market Today: Dow, S&P Live Updates for Oct. 1, 2021 Bloomberg.com
  • Stock Market Today: Dow, S&P Live Updates for Oct. 25, 2021 Bloomberg.com
  • Dow Jones Futures: Apple, Microsoft Lead 7 Stocks In Earnings ... Investor's Business Daily
  • Stocks End Week with Gains; Dow Notches New Record The Wall Street Journal
  • Dow closes at a record, posts third-straight positive week CNBC
  • MOEX Russia, RTS indexes rising by end of trading session TASS
  • Russian rouble hits more than 14-month peak vs euro, MOEX at record high Nasdaq
  • MOEX Russia, RTS indexes falling by end of trading day TASS
  • Russian stock indices MOEX, RTS rising as trading day ended TASS

    Top 20 Index Longs Based on Momentum

    MLIndexnameweek1monthytd6months1yrRank
    SHRTDX3 IndexDeutsche BoerseShortDAX x3 TR EUR7.8616-34.69-452468.38999.99
    NTCS11LV IndexTokyo Commodity ExchangeNikkei-JPX LV Cr Oil18.3336.59164.7180.66237.7393.33
    SPGSNGP IndexStandard & Poor'sS&P GSCI Natural Gas ER15.2532.85136.9135.7493.6169.36
    SOLGLOIN IndexSolactive (Structured SolutionSolactive Gl Oil Eq NR7.4627.8993.7536.56193.1966.28
    BCOMNG3T IndexBloombergBBG Nat Gas 3 M Fwd TR10.3827.6117.95115.7590.1560.97
    DWETR IndexNew York Stock Exchange (NYSE)Dyn En E&P Intellidex TR5.7321.68101.3640.13174.2260.44
    DWENTR IndexNASDAQ Global MarketDorsey Wright TL En TR6.7526.0489.7238.06161.2758.03
    BCOMNG IndexBloombergBBG Natural Gas9.1825.59117.16117.8976.8457.38
    SPSU6ET IndexStandard & Poor'sSP SC 600 Cap Enrgy TR6.7121.1785.2434.43164.3756.67
    SPOILH IndexStandard & Poor'sS&P 500 Oil-hedged5.5310.4196.644.99157.9754.73
    TTENAR IndexStandard & Poor'sS&P/TSX CAP ENERGY TR IX7.3120.7173.5232.12154.3353.62
    XTNGGT IndexBloombergCMCI Natgas Hdg GBP TR8.2317.5496.5791.9884.0250.44
    CTNGTR IndexBloombergCMCI Nat Gas USD Tot Ret720.2297.9694.4375.7749.36
    XTNGCT IndexCMCI NGas NYM Hdg CHF TR7.7318.1687.0992.7871.8347.63
    SPCPOGN IndexStandard & Poor'sS&P CP O&G Expl&Prod NTR6.7723.0971.9332.57123.3846.45
    XTNGET IndexBloombergCMCI NGas NYM Hdg EUR TR6.5216.6786.1687.9971.5145.67
    BCOMEN3T IndexBloombergBBG Energy 3 M Fwd TR6.8617.781.9155.5488.2742.09
    SPGSENTR IndexStandard & Poor'sS&P GSCI Energy Tot Ret6.9516.1372.341.5198.4240.75
    BCOMHO IndexBloombergBBG Heat Oil7.3314.8566.5535.82102.740.18
    SPGCBRTR IndexStandard & Poor'sSPGCBRTR5.7214.7668.8336.75101.6439.72

    Top 20 Index Shorts Based on Momentum

    MLIndexnameweek1monthytd6months1yrRank
    NTCS11IV IndexTokyo Commodity ExchangeNikkei-JPX IV Cr Oil-7.63-17.12-51.2-31.81-57.62-28.55
    MUTFPALL IndexMUFG BankMUFG Commodity Palladium0.5-22.45-18.33-28.94-19.65-17.63
    HXCX IndexNASDAQ Global MarketGolden Dragon China TR-0.12-13.6-34.83-34.37-22.17-17.56
    PLDMLNPM IndexLondon Metal Exchange - LMELondon Metal Exchange Palladiu0.05-20.72-18.96-28.21-19.92-17.20
    CACDSH IndexEuronextCAC 40 DOUBLE SHORT GR2.254.42-36.99-18.13-51.59-15.76
    IBEXDS IndexMadrid Stock ExchangeIBEX 35 Double Short1.89-1.1-27.38-13.43-48.19-15.21
    M1EF0CD IndexMSCIMSCI EM/CONSUMER D NR-3.23-12.05-24.64-22.59-19.99-14.47
    UKXI3X IndexFTSEFTSE 100 UKXI3X65.65-33.59-13.29-49.04-12.67
    HUINTR IndexNew York Stock Exchange (NYSE)NYSE Arca Gold BUGS TR3.09-9.96-21.7-17.47-25.85-12.55
    US0012M IndexICE Benchmark AdministrationICE LIBOR USD 12 Month-3.595.69-32.14-18.81-32.53-12.31
    FTMIGMI IndexFTSEFTSE Gold Mines Index3.3-9.4-20.29-14.94-26.79-11.96
    NCL9000X IndexNASDAQ OMXNASDAQ OMX CHN Tech TR-2.66-13.14-21.4-26.31-4.84-11.74
    XIN0I IndexFTSEFTSE China 50 Index HKD-4.29-10.6-20.98-20.37-11.17-11.61
    HSI21N IndexHang Seng Indexes Company LimiHang Seng China Ente NR-3.99-10.17-20.08-21.58-10.01-11.44
    GDMNTR IndexNew York Stock Exchange (NYSE)NYSE Arca Gold MinersNTR2.46-10.58-17.32-14.44-21.99-11.14
    JCGMGGI IndexMarkitGlobal Mining Glob Gol2.68-10.19-17.35-13.8-23.06-11.09
    TFTMIGMI IndexFTSEFTSE Gold Mines Index TR3.29-8.98-18.52-13.72-24.91-11.08
    XINOU IndexFTSEFTSE China 50 HKD-3.34-9.71-20.19-19.58-10.29-10.73
    MXCNX IndexMSCIMSCI CHINA FREE-2.09-9.23-19.58-19.52-11.91-10.69
    MSEUSCF IndexMSCIMSCI China USD-2.09-9.23-19.56-19.51-11.9-10.68

    Best Indexes last Week

    MLIndexnameyesterdayytdweek1month6months1yrRank
    NTCS11LV Index Tokyo Commodity ExchangeNikkei-JPX LV Cr Oil5.51164.7118.3336.5980.66237.7393.33
    XTCTCT Index CMCI Cotton Hdg CHF TR4.4637.2611.4517.5835.1662.7231.73
    BCOMNG3T Index BloombergBBG Nat Gas 3 M Fwd TR-4.69117.9510.3827.6115.7590.1560.97
    XTCTET Index CMCI Cotton Hdg EUR TR4.0736.2910.2216.1331.8262.2430.10
    BCOMNG Index BloombergBBG Natural Gas-5.14117.169.1825.59117.8976.8457.38
    XTNGGT Index BloombergCMCI Natgas Hdg GBP TR-4.0596.578.2317.5491.9884.0250.44
    SHRTDX3 Index Deutsche BoerseShortDAX x3 TR EUR4.41-34.697.8616-452468.38999.99
    NKYINV Index NikkeiNIKKEI Inverse Indx1.15-9.937.765.964.79-21.73-0.81
    XTNGCT Index CMCI NGas NYM Hdg CHF TR-3.7287.097.7318.1692.7871.8347.63
    SOLGLOIN Index Solactive (Structured SolutionSolactive Gl Oil Eq NR-0.3393.757.4627.8936.56193.1966.28
    BCOMHO Index BloombergBBG Heat Oil-0.8166.557.3314.8535.82102.740.18
    BCOMRB Index BloombergBBG Unleaded Gasoline-1.470.597.0111.5232.1397.4537.03
    XTXBCT Index CMCI RBOB Gas Hdg CHF TR-1.2660.2979.1630.3589.734.05
    CTNGTR Index BloombergCMCI Nat Gas USD Tot Ret-3.6397.96720.2294.4375.7749.36
    BCOMEN3T Index BloombergBBG Energy 3 M Fwd TR-2.3581.916.8617.755.5488.2742.09
    BCOMHO3T Index BloombergBBG Heat Oil 3 M Fwd TR-0.9363.956.8313.6833.9794.9637.36
    BCOMBO Index BloombergBBG Soybean Oil0.8864.136.664.5429.71111.0337.99
    XTNGET Index BloombergCMCI NGas NYM Hdg EUR TR-4.1186.166.5216.6787.9971.5145.67
    XTWWCT Index BloombergCMCI Wheat Hdg CHF TR0.611.836.171.6515.2922.4911.40
    UKXI3X Index FTSEFTSE 100 UKXI3X3.31-33.5965.65-13.29-49.04-12.67

    Worst Indexes last Week

    MLIndexnameyesterdayytdweek1month6months1yrRank
    KOSPI2LG Index KOSPI Stock MarketKOSPI200 Leverage IDX-3.85-14.82-9.52-20.32-24.9138.04-4.18
    KRXTRN Index KOSPI Stock MarketKRX Transport Sec Idx-4.5319.12-8.96-13.45-3.9764.39.48
    TPXLEV2X Index Tokyo Stock ExchangeTOPIX Leveraged 2X IDX-0.55.22-8.81-10.97-4.5328.791.12
    LEVDAX3 Index Deutsche BoerseLevDAX x3 AR (TR) EUR-5.3817-8.61-20.3-10.5841.830.58
    KRXCST Index KOSPI Stock MarketKRX CONSTRUCTIONS INDX-5.8413.91-7.82-11.05-4.1749.616.64
    NTCS11IV Index Tokyo Commodity ExchangeNikkei-JPX IV Cr Oil-2.61-51.2-7.63-17.12-31.81-57.62-28.55
    KRXMETEL Index KOSPI Stock MarketKRX MEDIA & TELECOM INDX-2.7822.61-7.08-7.438.4335.557.37
    KRXSHIP Index KOSPI Stock MarketKRX Machinery & Equip-4.463.9-7.07-10.54-2.5433.233.27
    FNGDKE30 Index FNGuide IncFnGuide Inc MKF KOSDAQ ELITE30-2.06-6-7.04-18.89-13.820.71-4.76
    KRXENCM Index KOSPI Stock MarketKRX ENERGY & CHEM INDX-3.219.11-6.67-1.83-0.8143.848.63
    NKYTR Index NikkeiNikkei Total Return Idx-0.96-5.6-6.32-7.86-8.1913.26-2.28
    NKYCC Index NikkeiNIKKEI Covered Call Indx-0.96-7.54-6.3-8.61-9.158.8-3.82
    FNGDMOIN Index FNGuide IncFnGuide Inc Momentum Index-2.9219.61-6.17-2.235.2631.497.09
    FNGDEXPO Index FNGuide IncFnGuide Inc MKF Exporters Inde-2.868.1-6.1-7.27-5.432.013.31
    FNGDSBLC Index FNGuide IncFnGuide Inc MKF Star Bluechip-1.87-5.04-6.08-19.98-13.0613.6-6.38
    TWSEMACH Index Taiwan Stock ExchangeTAIWAN TAIEX MACHINERY-0.53-4.84-6.01-4.62-16.3914.31-3.18
    KSP2EC Index KOSPI Stock MarketKOSPI200 Eng&Chem-3.037.05-6-2.1-3.5640.667.25
    D1AJ Index Deutsche BoerseLevDAX Index-3.7610.25-5.92-14.62-7.2728.570.19
    LEVDAX Index Deutsche BoerseLevDAX Index-3.7510.25-5.91-14.62-7.2828.570.19
    FNGDAUIN Index FNGuide IncFFnGuide Inc Automobiles Index-2.58-2.14-5.9-14.37-19.0420.17-4.79

    Best Indexes last Month

    MLIndexnameyesterdayytdweek1month6months1yrRank
    NTCS11LV Index Tokyo Commodity ExchangeNikkei-JPX LV Cr Oil5.51164.7118.3336.5980.66237.7393.33
    SOLGLOIN Index Solactive (Structured SolutionSolactive Gl Oil Eq NR-0.3393.757.4627.8936.56193.1966.28
    BCOMNG3T Index BloombergBBG Nat Gas 3 M Fwd TR-4.69117.9510.3827.6115.7590.1560.97
    BCOMNG Index BloombergBBG Natural Gas-5.14117.169.1825.59117.8976.8457.38
    CTNGTR Index BloombergCMCI Nat Gas USD Tot Ret-3.6397.96720.2294.4375.7749.36
    XTNGCT Index CMCI NGas NYM Hdg CHF TR-3.7287.097.7318.1692.7871.8347.63
    BCOMEN3T Index BloombergBBG Energy 3 M Fwd TR-2.3581.916.8617.755.5488.2742.09
    XTCTCT Index CMCI Cotton Hdg CHF TR4.4637.2611.4517.5835.1662.7231.73
    XTNGGT Index BloombergCMCI Natgas Hdg GBP TR-4.0596.578.2317.5491.9884.0250.44
    XTNGET Index BloombergCMCI NGas NYM Hdg EUR TR-4.1186.166.5216.6787.9971.5145.67
    XTCTET Index CMCI Cotton Hdg EUR TR4.0736.2910.2216.1331.8262.2430.10
    SHRTDX3 Index Deutsche BoerseShortDAX x3 TR EUR4.41-34.697.8616-452468.38999.99
    BCOMHO Index BloombergBBG Heat Oil-0.8166.557.3314.8535.82102.740.18
    SMISL Index Six Swiss ExchangeSMI Daily Short Leverage1.58-25.233.0814.42-9.22-30.91-5.66
    EUCRBRDT Index BloombergEuropean Crude Dated Brent Spo-1.1360.264.6313.9531.07101.937.89
    BCOMPE Index BloombergBBG Petroleum-1.0566.775.3513.7135.2696.4937.70
    BCOMHO3T Index BloombergBBG Heat Oil 3 M Fwd TR-0.9363.956.8313.6833.9794.9637.36
    BCOMCO Index BloombergBBG Brent Crude-168.134.8113.6835.8898.9438.33
    BCOMCL Index BloombergBBG WTI Crude Oil-1.0464.854.4513.1634.1992.6136.10
    CMENTR Index CMCI Energy USD Tot Ret-1.2465.995.1813.1338.3285.4735.53

    Worst Indexes last Month

    MLIndexnameyesterdayytdweek1month6months1yrRank
    NTCS11LV Index Tokyo Commodity ExchangeNikkei-JPX LV Cr Oil5.51164.7118.3336.5980.66237.7393.33
    SOLGLOIN Index Solactive (Structured SolutionSolactive Gl Oil Eq NR-0.3393.757.4627.8936.56193.1966.28
    BCOMNG3T Index BloombergBBG Nat Gas 3 M Fwd TR-4.69117.9510.3827.6115.7590.1560.97
    BCOMNG Index BloombergBBG Natural Gas-5.14117.169.1825.59117.8976.8457.38
    CTNGTR Index BloombergCMCI Nat Gas USD Tot Ret-3.6397.96720.2294.4375.7749.36
    XTNGCT Index CMCI NGas NYM Hdg CHF TR-3.7287.097.7318.1692.7871.8347.63
    BCOMEN3T Index BloombergBBG Energy 3 M Fwd TR-2.3581.916.8617.755.5488.2742.09
    XTCTCT Index CMCI Cotton Hdg CHF TR4.4637.2611.4517.5835.1662.7231.73
    XTNGGT Index BloombergCMCI Natgas Hdg GBP TR-4.0596.578.2317.5491.9884.0250.44
    XTNGET Index BloombergCMCI NGas NYM Hdg EUR TR-4.1186.166.5216.6787.9971.5145.67
    XTCTET Index CMCI Cotton Hdg EUR TR4.0736.2910.2216.1331.8262.2430.10
    SHRTDX3 Index Deutsche BoerseShortDAX x3 TR EUR4.41-34.697.8616-452468.38999.99
    BCOMHO Index BloombergBBG Heat Oil-0.8166.557.3314.8535.82102.740.18
    SMISL Index Six Swiss ExchangeSMI Daily Short Leverage1.58-25.233.0814.42-9.22-30.91-5.66
    EUCRBRDT Index BloombergEuropean Crude Dated Brent Spo-1.1360.264.6313.9531.07101.937.89
    BCOMPE Index BloombergBBG Petroleum-1.0566.775.3513.7135.2696.4937.70
    BCOMHO3T Index BloombergBBG Heat Oil 3 M Fwd TR-0.9363.956.8313.6833.9794.9637.36
    BCOMCO Index BloombergBBG Brent Crude-168.134.8113.6835.8898.9438.33
    BCOMCL Index BloombergBBG WTI Crude Oil-1.0464.854.4513.1634.1992.6136.10
    CMENTR Index CMCI Energy USD Tot Ret-1.2465.995.1813.1338.3285.4735.53

    Best Indexes YTD

    MLIndexnameyesterdayytdweek1month6months1yrRank
    NTCS11LV Index Tokyo Commodity ExchangeNikkei-JPX LV Cr Oil5.51164.7118.3336.5980.66237.7393.33
    BCOMNG3T Index BloombergBBG Nat Gas 3 M Fwd TR-4.69117.9510.3827.6115.7590.1560.97
    BCOMNG Index BloombergBBG Natural Gas-5.14117.169.1825.59117.8976.8457.38
    CTNGTR Index BloombergCMCI Nat Gas USD Tot Ret-3.6397.96720.2294.4375.7749.36
    XTNGGT Index BloombergCMCI Natgas Hdg GBP TR-4.0596.578.2317.5491.9884.0250.44
    SOLGLOIN Index Solactive (Structured SolutionSolactive Gl Oil Eq NR-0.3393.757.4627.8936.56193.1966.28
    XTNGCT Index CMCI NGas NYM Hdg CHF TR-3.7287.097.7318.1692.7871.8347.63
    XTNGET Index BloombergCMCI NGas NYM Hdg EUR TR-4.1186.166.5216.6787.9971.5145.67
    BCOMEN3T Index BloombergBBG Energy 3 M Fwd TR-2.3581.916.8617.755.5488.2742.09
    RIEHNGTR Index CQGRICI Enh Natural Gas TR-2.2276.084.8811.971.968.0439.18
    BCOMRB Index BloombergBBG Unleaded Gasoline-1.470.597.0111.5232.1397.4537.03
    DBOLIX Index New York Stock Exchange (NYSE)DBIQ OptYld Crude Ix ER-1.1570.074.3112.7434.8597.2437.29
    DBODIX Index DBLC Opt Yld Oil Exc Rtn-1.1570.074.3112.7434.8597.2437.29
    CTWCER3M Index CMCI WTI $ Ex Ret 3M-1.0369.094.471336.6995.8237.50
    BCOMCL3T Index BloombergBBG WTI Crd Oil 3M F TR-1.0968.824.4512.4635.7693.4836.54
    BCOMCO Index BloombergBBG Brent Crude-168.134.8113.6835.8898.9438.33
    BCOMPE Index BloombergBBG Petroleum-1.0566.775.3513.7135.2696.4937.70
    BCOMHO Index BloombergBBG Heat Oil-0.8166.557.3314.8535.82102.740.18
    BCOMPE3T Index BloombergBBG Petro 3 M Fwd TR-1.0966.035.1212.934.6691.9436.16
    CMENTR Index CMCI Energy USD Tot Ret-1.2465.995.1813.1338.3285.4735.53

    Worst Indexes YTD

    MLIndexnameyesterdayytdweek1month6months1yrRank
    NTCS11IV Index Tokyo Commodity ExchangeNikkei-JPX IV Cr Oil-2.61-51.2-7.63-17.12-31.81-57.62-28.55
    CACDSH Index EuronextCAC 40 DOUBLE SHORT GR2.85-36.992.254.42-18.13-51.59-15.76
    SHRTDX3 Index Deutsche BoerseShortDAX x3 TR EUR4.41-34.697.8616-452468.38999.99
    UKXI3X Index FTSEFTSE 100 UKXI3X3.31-33.5965.65-13.29-49.04-12.67
    IBEXDS Index Madrid Stock ExchangeIBEX 35 Double Short3.07-27.381.89-1.1-13.43-48.19-15.21
    SUNIDX Index Dow JonesMACGlbSolarEgyTR-0.79-26.14-2.16-14.3-13.116.51-5.77
    SHRTDAX2 Index Deutsche BoerseSHORTDAX X2 INDEX2.78-25.235.079.65-2.8-33.63-5.43
    SMISL Index Six Swiss ExchangeSMI Daily Short Leverage1.58-25.233.0814.42-9.22-30.91-5.66
    TR20I Index Dow JonesDJ TURKEY TITANS 20-1.33-23.11-0.62-13.19-3.053.45-3.35
    UKXI2X Index FTSEFTSE 100 UKXI2X2.06-23.034.43.24-8.76-33.75-8.72
    XU100 Index Istanbul Stock ExchangeBIST 100 INDEX-1.34-22.19-1.06-13.16-9.384.51-4.77
    FMIBI1X Index FTSEFTSE MIB FMIBI1X1.04-22.190.16-0.67-10.54-30.21-10.32
    SXNRS Index STOXXSTXE6IGSDSht (EUR)TR (GR)1.14-21.7824.79-8.14-28.24-7.40
    NCL9000X Index NASDAQ OMXNASDAQ OMX CHN Tech TR-1.42-21.4-2.66-13.14-26.31-4.84-11.74
    XIN0I Index FTSEFTSE China 50 Index HKD-0.99-20.98-4.29-10.6-20.37-11.17-11.61
    XTSETR Index CMCI Hdg Silver EUR TR-1.05-20.984.15-12.07-14.76-10.52-8.30
    TR20DT Index Dow JonesDJ TU Ttns20 T$-1.4-20.79-0.96-13.14-1.86.76-2.29
    XTSCTR Index CMCI Hdg Silver CHF TR-0.67-20.445.32-10.99-12.69-10.32-7.17
    TFBRICU Index FTSEFTSE BRIC 50 INDEX TRI $-0.82-20.21-3.19-10-18.96-8.96-10.28
    HSI21N Index Hang Seng Indexes Company LimiHang Seng China Ente NR-1.23-20.08-3.99-10.17-21.58-10.01-11.44

    Best Indexes 1yr

    MLIndexnameyesterdayytdweek1month6months1yrRank
    SHRTDX3 Index Deutsche BoerseShortDAX x3 TR EUR4.41-34.697.8616-452468.38999.99
    NTCS11LV Index Tokyo Commodity ExchangeNikkei-JPX LV Cr Oil5.51164.7118.3336.5980.66237.7393.33
    SOLGLOIN Index Solactive (Structured SolutionSolactive Gl Oil Eq NR-0.3393.757.4627.8936.56193.1966.28
    BCOMBO Index BloombergBBG Soybean Oil0.8864.136.664.5429.71111.0337.99
    BCOMHO Index BloombergBBG Heat Oil-0.8166.557.3314.8535.82102.740.18
    EUCRBRDT Index BloombergEuropean Crude Dated Brent Spo-1.1360.264.6313.9531.07101.937.89
    BCOMCO Index BloombergBBG Brent Crude-168.134.8113.6835.8898.9438.33
    BCOMRB Index BloombergBBG Unleaded Gasoline-1.470.597.0111.5232.1397.4537.03
    DBOLIX Index New York Stock Exchange (NYSE)DBIQ OptYld Crude Ix ER-1.1570.074.3112.7434.8597.2437.29
    DBODIX Index DBLC Opt Yld Oil Exc Rtn-1.1570.074.3112.7434.8597.2437.29
    BCOMPE Index BloombergBBG Petroleum-1.0566.775.3513.7135.2696.4937.70
    CTWCER3M Index CMCI WTI $ Ex Ret 3M-1.0369.094.471336.6995.8237.50
    BCOMHO3T Index BloombergBBG Heat Oil 3 M Fwd TR-0.9363.956.8313.6833.9794.9637.36
    BCOMCL3T Index BloombergBBG WTI Crd Oil 3M F TR-1.0968.824.4512.4635.7693.4836.54
    DBODIXX Index NYSE AMEXDBLC Oil Exc Rtn Idx-1.1364.994.3113.0234.3593.1536.21
    BCOMCL Index BloombergBBG WTI Crude Oil-1.0464.854.4513.1634.1992.6136.10
    BCOMPE3T Index BloombergBBG Petro 3 M Fwd TR-1.0966.035.1212.934.6691.9436.16
    BCOMNG3T Index BloombergBBG Nat Gas 3 M Fwd TR-4.69117.9510.3827.6115.7590.1560.97
    XTXBCT Index CMCI RBOB Gas Hdg CHF TR-1.2660.2979.1630.3589.734.05
    XTWCGT Index BloombergCMCI Crud Hdg GBP TR-1.3260.775.389.0131.1889.6333.80

    Worst Indexes 1yr

    MLIndexnameyesterdayytdweek1month6months1yrRank
    NTCS11IV Index Tokyo Commodity ExchangeNikkei-JPX IV Cr Oil-2.61-51.2-7.63-17.12-31.81-57.62-28.55
    CACDSH Index EuronextCAC 40 DOUBLE SHORT GR2.85-36.992.254.42-18.13-51.59-15.76
    UKXI3X Index FTSEFTSE 100 UKXI3X3.31-33.5965.65-13.29-49.04-12.67
    IBEXDS Index Madrid Stock ExchangeIBEX 35 Double Short3.07-27.381.89-1.1-13.43-48.19-15.21
    UKXI2X Index FTSEFTSE 100 UKXI2X2.06-23.034.43.24-8.76-33.75-8.72
    SHRTDAX2 Index Deutsche BoerseSHORTDAX X2 INDEX2.78-25.235.079.65-2.8-33.63-5.43
    SMISL Index Six Swiss ExchangeSMI Daily Short Leverage1.58-25.233.0814.42-9.22-30.91-5.66
    FMIBI1X Index FTSEFTSE MIB FMIBI1X1.04-22.190.16-0.67-10.54-30.21-10.32
    SXNRS Index STOXXSTXE6IGSDSht (EUR)TR (GR)1.14-21.7824.79-8.14-28.24-7.40
    IBEXSH Index Madrid Stock ExchangeIBEX 35 SHORT INDEX1.29-16.410.75-1.76-7.85-27.4-9.07
    FKOSPI2I Index KOSPI Stock MarketF-KOSPI200 Inverse0.89-9.423.686.143.07-23.44-2.64
    GDMNTR Index New York Stock Exchange (NYSE)NYSE Arca Gold MinersNTR-0.24-17.322.46-10.58-14.44-21.99-11.14
    NKYINV Index NikkeiNIKKEI Inverse Indx1.15-9.937.765.964.79-21.73-0.81
    MCXI1X Index FTSEFTSE 250 MCXI1X1.18-11.314.676.17-3.27-19.92-3.09
    MUTFPALL Index MUFG BankMUFG Commodity Palladium0.09-18.330.5-22.45-28.94-19.65-17.63
    SHORTDAX Index Deutsche BoerseSHORTDAX Index1.15-15.732.293.38-2.56-18.48-3.84
    LIPROPTR Index Dow JonesLippo Select HK TR Index0.44-13.690.44-6.87-20.8-15.28-10.63
    TBDIGRP Index Thai Bond Market AssociationThai Bond Dealing Centre All G-0.24-16.48-0.1-5.74-7.22-12.83-6.47
    NTCCS4LV Index Osaka Securities ExchangeNikkei-JPX LV Gold0.45-7.72.69-6.062.26-12.42-3.38
    XTGETR Index BloombergCMCI Hdg Gold EUR TR-0.69-13.731.51-7.01-3.04-11.72-5.06

    Latest ML Comics

    Rob is penetrating wrestling craft
    Rob is penetrating consumer discretionary sector
    Rob is penetrating consumer discretionary sector
    Markets have been rising on fears of attack on North Korea, then they were rising as the threat of North Korea risk off was less. After some huff and puff - Rob decided to try and raise some money for his future automotive engineering business.
    Initial Team
    4 Wheel drive and thoughts about business
    Rear Engine Transmission Shift Problem
    6 Wheeler in the Making
    Rob has a new plan

    Recent ML Rural Highlights. Small Towns and Villages

    Vaskoh-Romania
    Artvin-Turkey
    Gorishkino-Russia
  • Midlincoln deurbanisation enterprise intitiative

    This section contains links to materials about Midlincoln deurbanisation enterprise intitiative.

    Midlincoln is testing rural co-working model as its core business. Half of the co-working space is dedicated to investment analytics service and half of the space is industrial, creative environment with machines and tools which can be used in product development and small scale production. Our deurbanisation enterprise intitiative includes the following ideas:

    Midlincoln Research
    Financials

    Investment Research

    View Midlincoln Research One Pager

    Mount Maple
    Souvenirs
    Cons. Cyclicals

    Consumer Cyclicals

    View the souvenir producer one pager

    Midlincoln
    Craft Fund

    Midlincoln Craft Fund

    View Midlincoln Craft Fund Description

    TamaraAvia
    Automotive

    Engineering

    View intro for this automotive producer

    Wrestling, Healthcare and
    Entertainment

    ITI RTS ETF Report

    Read about wrestling craft business

    Village Telecoms
    and Media

    Telecoms

    Coming up and not ready yet

    Small Scale
    Energy

    Energy

    Coming up and not ready yet

    Small Scale
    Materials

    Materials

    Coming up and not ready yet

    Verical Agri
    and Food Production

    Consumer Staples

    Coming up and not ready yet

    Heating, Water, Electrics
    Installation and Repair

    Utilities

    Coming up and not ready yet

    Home Electronics
    Repair

    technology

    Coming up and not ready yet

    Russian Macro
    and
    RTS vs. MSCI and RSX

    ITI RTS ETF Report

    View Russian Macro and RTS vs. MSCI Report

    Russian
    Domestic
    Liquidity

    RTS Future vs. ETF

    View Russian Domestic Liquidity Report

    ETFs on Moex
    and
    Abroad

    RTS Future vs. ETF

    View Russian ETF Industry Report

    ITI Russian Eurobonds ETF

    ITI Bonds ETF Report

    View ITI Bonds ETF Report

    ITI Funds
    RTS Index
    ETF

    ITI RTS ETF Report

    View ITI RTS ETF Report

    RTS Futures
    vs
    RTS ETF

    RTS Future vs. ETF

    View Futures match price, and not TR Report