image
Midlincoln Index Atlas December 25, 2019
If your are viewing this document on a mobile device click here to skip part with data and go directly to content part

Midlincoln deurbanisation enterprise intitiative

This section contains links to materials about Midlincoln deurbanisation enterprise intitiative.

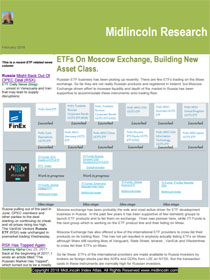
Midlincoln is testing rural co-working model as its core business. Half of the co-working space is dedicated to investment analytics service and half of the space is industrial, creative environment with machines and tools which can be used in product development and small scale production. Our deurbanisation enterprise intitiative includes the following ideas:

Midlincoln Research
Financials

Investment Research

View Midlincoln Research One Pager

Mount Maple
Souvenirs
Cons. Cyclicals

Consumer Cyclicals

View the souvenir producer one pager

Midlincoln
Craft Fund

Midlincoln Craft Fund

View Midlincoln Craft Fund Description

TamaraAvia
Automotive

Engineering

View intro for this automotive producer

Wrestling, Healthcare and
Entertainment

ITI RTS ETF Report

Read about wrestling craft business

Village Telecoms
and Media

Telecoms

Coming up and not ready yet

Small Scale
Energy

Energy

Coming up and not ready yet

Small Scale
Materials

Materials

Coming up and not ready yet

Verical Agri
and Food Production

Consumer Staples

Coming up and not ready yet

Heating, Water, Electrics
Installation and Repair

Utilities

Coming up and not ready yet

Home Electronics
Repair

technology

Coming up and not ready yet

Russian Macro
and
RTS vs. MSCI and RSX

ITI RTS ETF Report

View Russian Macro and RTS vs. MSCI Report

Russian
Domestic
Liquidity

RTS Future vs. ETF

View Russian Domestic Liquidity Report

ETFs on Moex
and
Abroad

RTS Future vs. ETF

View Russian ETF Industry Report

ITI Russian Eurobonds ETF

ITI Bonds ETF Report

View ITI Bonds ETF Report

ITI Funds
RTS Index
ETF

ITI RTS ETF Report

View ITI RTS ETF Report

RTS Futures
vs
RTS ETF

RTS Future vs. ETF

View Futures match price, and not TR Report

Top 20 Long Index Ideas YTD From Best to Worst

objectiveYTD
FRANCE45.90
RUSSIA34.14
PRECIOUS METAL SECTOR31.41
TECHNOLOGY SECTOR30.09
TECHNOLOGY29.82
ITALY26.32
NETHERLANDS25.48
AGGRESSIVE ALLOCAT00004E4BION25.38
EVENT DRIVEN DIVERSIFIED25.38
GROWTH MID CAP25.38
MACRO SYSTEMATIC DIVERSIFIED25.38
MANAGED FUTURES CURRENCY25.38
MANAGED FUTURES DISCRETIONARY25.38
MANAGED FUTURES SYSTEMATIC25.38
MUNI CA INTERMEDIATE AND SHORT25.38
MUNI CALIFORNIA LONG25.38
MUNI HIGH YIELD25.38
MUNI NATIONAL INTERMEDIATE25.38
MUNI NATIONAL SHORT25.38
MUNI NEW YORK LONG25.38

Top 20 Short Index Ideas YTD From Best to Worst

objectiveYTD
CHILE-19.39
POLAND-9.86
EQUITY HEDGE DIVERSIFIED-9.77
EQUITY HEDGE (FOHF)-5.76
EVENT DRIVEN SPECIAL SITUATION-3.88
FIXED INCOME ARBITRAGE-3.88
AGRICULTURE-2.58
D0A3YNAMIC ALLOCATION-1.74
ENHANCED MMKT (NON-US)-1.74
MACRO (FOHF)-1.74
SHORT BIASED-1.74
SPAIN-1.69
KOREA-1.08
PERU0.38
AGGREGATE BOND USD FOCUSED0.95
FOREIGN AGGREGATE BOND1.33
MIDDLE EAST REGION1.41
AGGREGATE BOND SHORT1.61
SOUTH AFRICA2.02
AGGREGATE BOND EURO FOCUSED2.46

Combined Performance of Tracked Indexes by Index Provider Top 20 Winners

sourcenameytd
Diapason Commodities43.235
NASDAQ OMX PSX36.73
RTS Exchange35.29
London Metal Exchange - LME29.245
BOVESPA26.849999999999998
SIX AB26.36
Russell Equity Indices26.025
CRSP25.804000000000002
Stuttgart Stock Exchange24.975
Morningstar24.948181818181812
Russell23.487999999999996
NYSE Euronext Amsterdam22.91
Cohen and Steers22.545
Shenzhen Stock Exchange22.4
Taiwan Stock Exchange21.3
Tokyo Stock Exchange21.2275
New York Stock Exchange (NYSE)20.868500000000004
NASDAQ Global Market20.853666666666673
Thai Bond Market Association20.52
Investment Trust20.4825

Combined Performance of Tracked Indexes by Index Provider Top 20 Losers

sourcenameytd
Bolsa de Comercio de Santiago-21.97
Cushing-16.44
Nigerian Stock Exchange-14.38
KOSPI Stock Market-13.27727272727273
Bulgaria Stock Exchange-11.12
Mauritius Stock Exchange-9.77
The Association of Banks in Si-5.98
FNGuide Inc-5.095454545454546
Merrill Lynch-4.585
Madrid Stock Exchange-3.81
ProShares-2.88
Teucrium-1.97
ICE Benchmark Administration-1.923333333333332
Banco Central do Brasil-1.74
National Stock Exchange of Ind-1.49
Statistics South Africa-1.11
Johannesburg Stock Exchange-0.31
Ossiam-0.12
WisdomTree0.4
Analistas Financieros Internac0.855

Chart: ML Index Atlas

Index Strategy Novermber 2019

Source: ML

Download All Slides in Power Point
  • Monosomes actively translate synaptic mRNAs in neuronal processes Science Magazine
  • Tobacco smoking and somatic mutations in human bronchial ... Nature.com
  • Technology Sector Update for 01/24/2020: FNJN,AVGO,ERIC,AAPL,INTC Nasdaq
  • NASDAQ Closes at New High as Coronavirus Fears Subside Nasdaq
  • The Zacks Analyst Blog Highlights: Alphabet, salesforce.com, L3Harris, McKesson and Synopsys Nasdaq
  • Exact Sciences, GameStop, Intel, Intuitive Surgical and Skyworks highlighted as Zacks Bull and Bear of the Day Nasdaq
  • Bank Stocks Q4 Earnings Due on Jan 27: TCF, BOH, CSFL, SSB Nasdaq
  • 3 Mutual Fund Misfires to Avoid - January 23, 2020 Nasdaq

    Key Topics and News

    Combined Performance of Tracked Indexes by Index Provider Top Losers
    Combined Performance of Tracked Indexes by Index Provider Top Winners
    Top 20 Short Index Ideas YTD From Best to Worst
    Index Ideas YTD From Best to Worst

    Recent Index Atlas Ideas ChartArt

    ML Index Atlas

    Download file in Power Point
    Index Atlas

    Download file in Power Point
    Midlincoln Index Atlas

    Download file in Power Point
    Index Atlas

    Download file in Power Point
    A year with new methodology - RTS Industrials stocks getting replaced by consumer goods companies

    Download file in Power Point
    Index Atlas Trade Ideas for 2019

    Download file in Power Point
    Long Palladium and Platinum

    Download file in Power Point
    Short DAX

    Download file in Power Point
    Long iBovespa

    Download file in Power Point

    Index Rebalancing News

    MSCI

  • Easing Over Emerging Markets Bumps ETFdb.com
  • Eurex takes ESG derivatives to a global level Risk.net
  • A Less Volatile Way to Invest in Emerging Markets Morningstar.com
  • MSCI launches ESG and factor fixed income indices ETF Strategy
  • IFM Investors Pty Ltd Has $2.16 Million Stake in Msci Inc (NYSE:MSCI) Riverton Roll

    Standard & Poor's Index

  • Cushing® Asset Management and Swank Capital Announce a Constituent Change to The Cushing® MLP Market Cap Index Yahoo Finance
  • Health Care ETF Finishes Strong Yahoo Finance
  • Buy These ETFs if U.S. Yield Curve Flattens Further Nasdaq
  • Form 497K VanEck Vectors ETF Trust StreetInsider.com
  • Why Grand Canyon Education Stock Jumped 12% Last Month Nasdaq

    Hang Seng

  • LONDON MARKET PRE-OPEN: Lawrence Stroll Races To Aston ... Morningstar
  • Hong Kong Stock Market Inherits Positive Lead Nasdaq
  • South Korea bourse's planned cap on index weighting seen forcing ... TODAYonline
  • China Market Update: Risk On, Foreign Reserves Climb Forbes
  • Form 424B2 GOLDMAN SACHS GROUP INC StreetInsider.com

    FTSE

  • FTSE Russell Expands Climate Risk-Adjusted Government Bond ... Exchange News Direct
  • FTSE 100 closes in red as China virus fears mount Proactive Investors UK
  • LONDON MARKET PRE-OPEN: Lawrence Stroll Races To Aston ... Morningstar
  • Form 424B2 ROYAL BANK OF CANADA StreetInsider.com
  • Beware the (income) trap ETF Stream

    Bloomberg Indices

  • Cushing® Asset Management and Swank Capital Announce a Constituent Change to The Cushing® MLP Market Cap Index Yahoo Finance
  • BMO Asset Management Inc. Announces Index Change for ZTL, Changes to Risk Ratings for Certain BMO ETF Listings and Clarification of Investment Objectives and Strategies for Certain BMO ETFs Yahoo Finance
  • Cushing® Asset Management and Swank Capital Announce ... PRNewswire (press release)
  • MSCI launches ESG and factor fixed income indices ETF Strategy
  • Samsung May See Passive Funds Cut Exposure Sooner Than Expected Yahoo Finance

    Dow Jones

  • This Dividend ETF Could be Getting Some new Holdings ETF Trends
  • New Dividend Aristocrats For 2020 Seeking Alpha
  • Cushing® Asset Management and Swank Capital Announce a Constituent Change to The Cushing® MLP Market Cap Index Yahoo Finance
  • The five biggest tech companies now make up 17.5% of the S&P 500 — here's how to protect yourself CNBC
  • Form 424B2 JPMORGAN CHASE & CO StreetInsider.com

    Moex Indexes

  • 5 Big Things to Expect From Stocks in 2020 CCN.com
  • Russian rouble, stocks slightly up; Trump, OFZ bonds in focus Nasdaq
  • EMERGING MARKETS-Chilean peso firms as copper prices scale seven-month highs Nasdaq
  • Form 6-K Yandex NV For: Nov 18 StreetInsider.com
  • Emerging Markets ‘Under Pressure’ After Fed Rate Hike: Inside EM BloombergQuint

    Index Futures Trading

    Top 20 Index Longs Based on Momentum

    MLIndexnameweek1monthytd6months1yrRank
    JGOLD IndexFTSEFTSE/JSE AFRICA GOLD MNG4.731.1977.7038.4799.2035.90
    NQCIPAER Index#N/A Field Not ApplicableNQCI Palladium ER2.135.2456.0236.5563.5826.88
    PLDMLNPM IndexLondon Metal Exchange - LMELondon Metal Exchange Palladiu0.982.8945.6736.4351.5222.96
    MUTFPALL IndexInvestment TrustMUFG TOCOM Palladium1.005.1344.5936.3847.1522.42
    LEVDAX3 IndexDeutsche BoerseLevDAX x3 TR EUR-1.72-0.8077.0023.4664.6921.41
    HUINTR IndexNew York Stock Exchange (NYSE)NYSE Arca Gold BUGS TR2.102.3437.3330.1747.0520.42
    MCXL2X IndexFTSEFTSE 250 MCXL2X2.199.1751.5823.4746.6120.36
    FMIBL2X IndexFTSEFTSE MIB FMIBL2X-0.36-1.5561.0826.8156.0120.23
    TTGDAR IndexStandard & Poor'sS&P/TSX Glob Gold TR Idx2.672.7938.6125.7548.4719.92
    XAU IndexNASDAQ OMX PSXPHILA GOLD & SILVER INDX1.262.6136.7329.9845.7019.89
    TFMIBL2E IndexFTSEFTSE MIB Leverag TR EUR-1.76-2.9658.8325.0653.8118.54
    CACGL Index#N/A Field Not ApplicableCAC 40 Leverage GR-0.980.0255.5017.0353.2117.32
    CACTL IndexEuronext ParisCAC 40 LEVERAGE NR-1.04-0.0552.6216.5650.2416.43
    TFTMIGMI IndexFTSEFTSE Gold Mines Index TR2.320.7732.6019.6842.2216.25
    TWSEELEC IndexTaiwan Stock ExchangeTAIWAN TAIEX ELECTRON IX2.020.2430.7727.8633.9516.02
    JCGMGGI IndexMarkitGlobal Mining Glob Gol2.050.5932.4119.4141.0815.78
    FTMIGMI IndexFTSEFTSE Gold Mines Index2.250.6231.2519.0840.6515.65
    SMILEP IndexSix Swiss ExchangeSMI Daily Leverage Price-0.012.7352.1014.0744.8215.40
    GDMNTR IndexNew York Stock Exchange (NYSE)NYSE Arca Gold MinersNTR0.560.0429.6719.3739.4514.86
    CACLV IndexBloombergCAC 40 Leverage Index-1.17-0.2445.9015.4343.3014.33

    Top 20 Index Shorts Based on Momentum

    MLIndexnameweek1monthytd6months1yrRank
    SHRTDX3 IndexDeutsche BoerseShortDAX x3 TR EUR1.89-0.35-56.42-30.21-53.52-20.55
    BCOMNG IndexBloombergBBG Natural Gas5.53-17.21-33.07-13.62-52.28-19.40
    SPSU6ET IndexStandard & Poor'sSP SC 600 Cap Enrgy TR1.15-7.00-29.20-27.16-42.91-18.98
    NQCINGER Index#N/A Field Not ApplicableNQCI Natural Gas ER5.52-17.27-26.28-8.57-48.62-17.24
    SPGSNGP IndexStandard & Poor'sS&P GSCI Natural Gas ER6.40-16.95-26.63-9.18-48.64-17.09
    CACDSH Index#N/A N/ACAC 40 DOUBLE SHORT GR1.44-0.68-44.84-22.45-43.92-16.40
    US0012M IndexICE Benchmark AdministrationICE LIBOR USD 12 Month-1.80-3.02-36.22-18.29-38.40-15.38
    SHRTDAX2 IndexDeutsche BoerseSHORTDAX X2 INDEX1.45-0.20-42.13-21.28-39.40-14.86
    MLPY IndexCushingCushing MLP High Inc Idx-1.00-10.34-16.44-24.19-23.49-14.75
    SMISL IndexSix Swiss ExchangeSMI Daily Short Leverage1.63-2.74-42.58-15.94-39.58-14.16
    KRXCST IndexKOSPI Stock MarketKRX CONSTRUCTIONS INDX-2.00-9.40-23.71-16.61-22.67-12.67
    XTNGET IndexBloombergCMCI NGas NYM Hdg EUR TR3.82-10.26-22.92-11.69-28.66-11.70
    SXNRS IndexSTOXXSTXE6IGSDSht (EUR)TR (GR)0.04-2.23-30.03-15.12-29.03-11.59
    DWOTR IndexNew York Stock Exchange (NYSE)Dyn Oil Ser Intellidex T0.66-0.62-15.12-15.61-30.23-11.45
    FMIBI1X IndexFTSEFTSE MIB FMIBI1X0.610.31-28.93-16.77-27.55-10.85
    XTNGCT Index#N/A Field Not ApplicableCMCI NGas NYM Hdg CHF TR4.35-10.06-21.04-9.92-26.62-10.56
    SOLGLOIN IndexSolactive (Structured SolutionSolactive Gl Oil Eq NR4.03-2.71-15.59-15.81-27.24-10.43
    DWETR IndexNew York Stock Exchange (NYSE)Dyn En E&P Intellidex TR1.02-5.17-14.24-10.60-26.80-10.39
    KRXENCM IndexKOSPI Stock MarketKRX ENERGY & CHEM INDX-3.11-8.16-18.72-8.76-20.75-10.20
    STRQEN IndexNew York Stock Exchange (NYSE)STRATAQUANT ENERGY3.35-2.15-17.98-12.09-29.45-10.09

    Best Indexes last Week

    MLIndexnameyesterdayytdweek1month6months1yrRank
    DBODIXX Index #N/A Field Not ApplicableDBLC Oil Exc Rtn Idx1.9528.458.055.6710.3112.729.19
    IPSA Index Standard & Poor'sS&P/CLX IPSA (CLP) TR0.61-17.317.76-2.08-14.96-19.67-7.24
    XTWCGT Index BloombergCMCI Crud Hdg GBP TR1.1825.967.717.2211.8112.859.90
    BCOMCL Index BloombergBBG WTI Crude Oil1.9027.937.705.6010.0812.598.99
    DBOLIX Index New York Stock Exchange (NYSE)DBIQ OptYld Crude Ix ER1.8824.177.685.9310.379.218.30
    NQCICLER Index #N/A Field Not ApplicableNQCI Crude Oil ER1.8727.897.675.569.9912.328.89
    DBODIX Index #N/A Field Not ApplicableDBLC Opt Yld Oil Exc Rtn1.8924.157.626.2910.269.158.33
    CHILE65 Index Bolsa de Comercio de SantiagoCHILE 65 INDEX0.66-21.977.59-2.90-17.44-23.93-9.17
    CTWCER3M Index #N/A Field Not ApplicableCMCI WTI $ Ex Ret 3M1.7728.087.175.6911.2512.949.26
    XTWCCT Index #N/A Field Not ApplicableCMCI WTI Crud Hdg CHF TR1.0719.927.075.107.378.857.10
    BCOMCL3T Index BloombergBBG WTI Crd Oil 3M F TR1.6329.396.745.7211.8814.579.73
    EUCRBRDT Index BloombergEuropean Crude Dated Brent Spo2.2024.006.715.741.9410.546.23
    XTWCET Index #N/A Field Not ApplicableCMCI WTI Crud Hdg EUR TR0.9817.016.524.875.355.745.62
    UKXI3X Index FTSEFTSE 100 UKXI3X-3.93-31.176.477.46-2.21-32.95-5.31
    XTCGTR Index BloombergCMCI Brent Hdg GBP TR0.9618.706.476.286.446.826.50
    BCOMCO Index BloombergBBG Brent Crude1.9227.916.205.768.5313.978.62
    CTWCTR Index BloombergCMCI WTI USD Tot Ret1.4424.236.155.159.3411.818.11
    CTWCER Index BloombergCMCI WTI USD Ex Ret1.4321.766.125.028.309.417.21
    BCOMPE Index BloombergBBG Petroleum1.9427.036.054.669.8313.318.46
    XTCCTR Index BloombergCMCI BCr TR Hdg CHF0.8513.025.854.192.253.043.83

    Worst Indexes last Week

    MLIndexnameyesterdayytdweek1month6months1yrRank
    UKXL3X Index FTSEFTSE 100 UKXL3X3.4137.11-3.71-4.081.4837.737.85
    BCOMWH Index BloombergBBG Wheat-0.190.17-3.460.261.26-2.16-1.03
    KRXENCM Index KOSPI Stock MarketKRX ENERGY & CHEM INDX0.49-18.72-3.11-8.16-8.76-20.75-10.20
    KSP2EC Index KOSPI Stock MarketKOSPI200 Eng&Chem0.75-18.08-2.85-7.71-6.82-20.57-9.49
    NQCISIER Index NASDAQ Global MarketNQCI Silver ER-2.513.50-2.64-6.318.3910.992.61
    BCOMSI Index BloombergBBG Silver-2.603.49-2.64-6.398.3710.972.58
    XTWWET Index BloombergCMCI Wheat Hdg EUR TR-0.57-8.15-2.640.09-3.93-9.32-3.95
    CMDYSIER Index Horizons ETFs Management (CanaHorizons ETFs Silver Excess Re-2.543.52-2.64-6.308.3511.012.61
    DJISVC Index Dow JonesDJ INTERNET SERVICE IDX0.4014.64-2.570.73-7.377.43-0.45
    DBSLIX Index Deutsche BankDBIQ OptYld Silver Ix ER-2.213.61-2.48-6.008.9710.922.85
    XTSETR Index #N/A Field Not ApplicableCMCI Hdg Silver EUR TR-2.91-0.59-2.30-6.415.527.020.96
    XTWWCT Index BloombergCMCI Wheat Hdg CHF TR-0.50-5.93-2.120.34-2.04-6.76-2.65
    XTLLET Index BloombergCMCI Lead Hdg EUR TR-1.22-10.69-2.01-10.990.04-8.57-5.38
    KRXCST Index KOSPI Stock MarketKRX CONSTRUCTIONS INDX0.49-23.71-2.00-9.40-16.61-22.67-12.67
    UKXL2X Index FTSEFTSE 100 UKXL2X2.1926.66-1.93-1.942.9327.146.55
    XTSCTR Index #N/A Field Not ApplicableCMCI Hdg Silver CHF TR-2.841.62-1.79-6.217.379.832.30
    NIFTYJR Index National Stock Exchange of IndNifty Next 50-1.10-2.87-1.74-2.65-1.022.94-0.62
    FNGDAIRN Index FNGuide IncFnGuide Inc Steel and Metal+ I0.03-19.53-1.73-4.97-11.72-19.57-9.50
    LEVDAX3 Index Deutsche BoerseLevDAX x3 TR EUR1.9777.00-1.72-0.8023.4664.6921.41
    RU1SSRTL Index RussellR1 Retail SubSec Index0.8522.37-1.71-1.323.6713.533.54

    Best Indexes last Month

    MLIndexnameyesterdayytdweek1month6months1yrRank
    RGUSHS Index RussellRuss2000Health Care1.3926.541.5212.6514.5511.6610.09
    BCOMKC Index BloombergBBG Coffee-0.045.734.8712.0412.871.647.86
    XTKCCT Index #N/A Field Not ApplicableCMCI Coffee Hdg CHF TR-0.402.725.5611.3710.67-0.146.87
    XTKCET Index BloombergCMCI Coffee Hdg EUR TR-0.470.375.0211.168.60-2.805.50
    MCXL2X Index FTSEFTSE 250 MCXL2X1.2451.582.199.1723.4746.6120.36
    DJUSBT Index Dow JonesDJ US TOT MKT BIOTECH IX0.8715.65-0.077.8013.518.087.33
    UKXI3X Index FTSEFTSE 100 UKXI3X-3.93-31.176.477.46-2.21-32.95-5.31
    XU100 Index Istanbul Stock ExchangeBIST 100 INDEX-0.169.301.377.2916.858.198.43
    XTWCGT Index BloombergCMCI Crud Hdg GBP TR1.1825.967.717.2211.8112.859.90
    XTQCGT Index BloombergCMCI Cocoa Hdg GBP TR0.4213.162.557.149.7026.2511.41
    BCOMCC Index BloombergBBG Cocoa0.935.831.446.934.3120.168.21
    BCOMSOTR Index BloombergBBG Softs TR0.520.842.716.842.68-4.451.95
    S5HLTH Index Standard & Poor'sS&P 500 HEALTH CARE IDX0.6215.750.916.3410.328.036.40
    DBODIX Index #N/A Field Not ApplicableDBLC Opt Yld Oil Exc Rtn1.8924.157.626.2910.269.158.33
    XTCGTR Index BloombergCMCI Brent Hdg GBP TR0.9618.706.476.286.446.826.50
    TELUKNG Index FTSEFTSE E/N UK Net TR GBP0.8428.732.236.1818.0025.2812.92
    DBOLIX Index New York Stock Exchange (NYSE)DBIQ OptYld Crude Ix ER1.8824.177.685.9310.379.218.30
    ELUK Index FTSEFTSE E/N UK0.8424.612.155.8716.0221.1211.29
    NTCS11LV Index NikkeiNikkei-TOCOM LV Cr Oil0.2433.50-1.365.877.72-1.902.58
    TR20DT Index Dow JonesDJ TU Ttns20 T$-0.2810.750.205.8414.1810.677.72

    Worst Indexes last Month

    MLIndexnameyesterdayytdweek1month6months1yrRank
    RGUSHS Index RussellRuss2000Health Care1.3926.541.5212.6514.5511.6610.09
    BCOMKC Index BloombergBBG Coffee-0.045.734.8712.0412.871.647.86
    XTKCCT Index #N/A Field Not ApplicableCMCI Coffee Hdg CHF TR-0.402.725.5611.3710.67-0.146.87
    XTKCET Index BloombergCMCI Coffee Hdg EUR TR-0.470.375.0211.168.60-2.805.50
    MCXL2X Index FTSEFTSE 250 MCXL2X1.2451.582.199.1723.4746.6120.36
    DJUSBT Index Dow JonesDJ US TOT MKT BIOTECH IX0.8715.65-0.077.8013.518.087.33
    UKXI3X Index FTSEFTSE 100 UKXI3X-3.93-31.176.477.46-2.21-32.95-5.31
    XU100 Index Istanbul Stock ExchangeBIST 100 INDEX-0.169.301.377.2916.858.198.43
    XTWCGT Index BloombergCMCI Crud Hdg GBP TR1.1825.967.717.2211.8112.859.90
    XTQCGT Index BloombergCMCI Cocoa Hdg GBP TR0.4213.162.557.149.7026.2511.41
    BCOMCC Index BloombergBBG Cocoa0.935.831.446.934.3120.168.21
    BCOMSOTR Index BloombergBBG Softs TR0.520.842.716.842.68-4.451.95
    S5HLTH Index Standard & Poor'sS&P 500 HEALTH CARE IDX0.6215.750.916.3410.328.036.40
    DBODIX Index #N/A Field Not ApplicableDBLC Opt Yld Oil Exc Rtn1.8924.157.626.2910.269.158.33
    XTCGTR Index BloombergCMCI Brent Hdg GBP TR0.9618.706.476.286.446.826.50
    TELUKNG Index FTSEFTSE E/N UK Net TR GBP0.8428.732.236.1818.0025.2812.92
    DBOLIX Index New York Stock Exchange (NYSE)DBIQ OptYld Crude Ix ER1.8824.177.685.9310.379.218.30
    ELUK Index FTSEFTSE E/N UK0.8424.612.155.8716.0221.1211.29
    NTCS11LV Index NikkeiNikkei-TOCOM LV Cr Oil0.2433.50-1.365.877.72-1.902.58
    TR20DT Index Dow JonesDJ TU Ttns20 T$-0.2810.750.205.8414.1810.677.72

    Best Indexes YTD

    MLIndexnameyesterdayytdweek1month6months1yrRank
    JGOLD Index FTSEFTSE/JSE AFRICA GOLD MNG-2.9777.704.731.1938.4799.2035.90
    LEVDAX3 Index Deutsche BoerseLevDAX x3 TR EUR1.9777.00-1.72-0.8023.4664.6921.41
    FMIBL2X Index FTSEFTSE MIB FMIBL2X1.4661.08-0.36-1.5526.8156.0120.23
    NQCIPAER Index #N/A Field Not ApplicableNQCI Palladium ER0.2256.022.135.2436.5563.5826.88
    CACGL Index #N/A Field Not ApplicableCAC 40 Leverage GR1.8255.50-0.980.0217.0353.2117.32
    SUNIDX Index Dow JonesMACGlbSolarEgyTR1.5555.072.572.256.8136.4812.03
    CACTL Index Euronext ParisCAC 40 LEVERAGE NR1.7952.62-1.04-0.0516.5650.2416.43
    SMILEP Index Six Swiss ExchangeSMI Daily Leverage Price1.3052.10-0.012.7314.0744.8215.40
    MCXL2X Index FTSEFTSE 250 MCXL2X1.2451.582.199.1723.4746.6120.36
    D1AJ Index Deutsche BoerseLevDAX Index1.1747.41-0.94-0.4815.2340.9813.70
    LEVDAX Index Deutsche BoerseLevDAX Index1.1847.41-0.96-0.4715.2440.9813.70
    CACLV Index BloombergCAC 40 Leverage Index1.7245.90-1.17-0.2415.4343.3014.33
    DJRUSGR Index Standard & Poor'sDJ Russia GDR T$1.2544.980.82-3.1113.8338.9012.61
    MUTFPALL Index Investment TrustMUFG TOCOM Palladium-0.2344.591.005.1336.3847.1522.42
    DWTYTR Index NASDAQ Global MarketDorsey Wright TL Tech TR0.6742.20-1.404.303.9134.4810.32
    DJUSTCT Index Dow JonesDJ US TechnlgyTr0.9141.04-0.303.1517.0331.7712.91
    NDXT Index NASDAQ Global MarketNASDAQ-100 TECH SEC INDX1.2439.39-0.422.1516.4330.6212.20
    BCOMRB Index BloombergBBG Unleaded Gasoline2.4739.234.183.0516.5525.7812.39
    DXRN Index Deutsche BoerseDAXgbl Russia EUR NR0.7938.921.15-3.5114.0233.3011.24
    DXS Index BloombergSPADE DEFENSE INDEX0.6938.79-1.040.457.5929.329.08

    Worst Indexes YTD

    MLIndexnameyesterdayytdweek1month6months1yrRank
    SHRTDX3 Index Deutsche BoerseShortDAX x3 TR EUR-2.85-56.421.89-0.35-30.21-53.52-20.55
    CACDSH Index #N/A N/ACAC 40 DOUBLE SHORT GR-2.68-44.841.44-0.68-22.45-43.92-16.40
    SMISL Index Six Swiss ExchangeSMI Daily Short Leverage-2.03-42.581.63-2.74-15.94-39.58-14.16
    SHRTDAX2 Index Deutsche BoerseSHORTDAX X2 INDEX-2.05-42.131.45-0.20-21.28-39.40-14.86
    BCOMNG Index BloombergBBG Natural Gas-0.87-33.075.53-17.21-13.62-52.28-19.40
    UKXI3X Index FTSEFTSE 100 UKXI3X-3.93-31.176.477.46-2.21-32.95-5.31
    SXNRS Index STOXXSTXE6IGSDSht (EUR)TR (GR)-1.41-30.030.04-2.23-15.12-29.03-11.59
    IBEXDS Index Madrid Stock ExchangeIBEX 35 Double Short-3.45-29.35-0.53-0.51-11.84-26.37-9.81
    FMIBI1X Index FTSEFTSE MIB FMIBI1X-1.38-28.930.610.31-16.77-27.55-10.85
    NQCINGER Index #N/A Field Not ApplicableNQCI Natural Gas ER-0.81-26.285.52-17.27-8.57-48.62-17.24
    SHORTDAX Index Deutsche BoerseSHORTDAX Index-1.24-24.640.94-0.11-12.04-22.63-8.46
    KRXCST Index KOSPI Stock MarketKRX CONSTRUCTIONS INDX0.49-23.71-2.00-9.40-16.61-22.67-12.67
    KRXMETEL Index KOSPI Stock MarketKRX MEDIA & TELECOM INDX1.30-23.30-1.23-1.95-9.05-26.00-9.56
    NTCS11IV Index NikkeiNikkei-TOCOM IV Cr Oil-0.28-23.171.34-3.47-12.83-11.54-6.63
    XTNGET Index BloombergCMCI NGas NYM Hdg EUR TR-0.69-22.923.82-10.26-11.69-28.66-11.70
    CHILE65 Index Bolsa de Comercio de SantiagoCHILE 65 INDEX0.66-21.977.59-2.90-17.44-23.93-9.17
    XTNGCT Index #N/A Field Not ApplicableCMCI NGas NYM Hdg CHF TR-0.62-21.044.35-10.06-9.92-26.62-10.56
    KRXSHIP Index KOSPI Stock MarketKRX Machinery & Equip1.05-20.16-1.03-5.00-6.74-22.93-8.93
    UKXI2X Index FTSEFTSE 100 UKXI2X-2.70-20.084.865.770.33-21.42-2.62
    FNGDAIRN Index FNGuide IncFnGuide Inc Steel and Metal+ I0.03-19.53-1.73-4.97-11.72-19.57-9.50

    Best Indexes 1yr

    MLIndexnameyesterdayytdweek1month6months1yrRank
    JGOLD Index FTSEFTSE/JSE AFRICA GOLD MNG-2.9777.704.731.1938.4799.2035.90
    LEVDAX3 Index Deutsche BoerseLevDAX x3 TR EUR1.9777.00-1.72-0.8023.4664.6921.41
    NQCIPAER Index #N/A Field Not ApplicableNQCI Palladium ER0.2256.022.135.2436.5563.5826.88
    FMIBL2X Index FTSEFTSE MIB FMIBL2X1.4661.08-0.36-1.5526.8156.0120.23
    CACGL Index #N/A Field Not ApplicableCAC 40 Leverage GR1.8255.50-0.980.0217.0353.2117.32
    CACTL Index Euronext ParisCAC 40 LEVERAGE NR1.7952.62-1.04-0.0516.5650.2416.43
    MUTFPALL Index Investment TrustMUFG TOCOM Palladium-0.2344.591.005.1336.3847.1522.42
    HUINTR Index New York Stock Exchange (NYSE)NYSE Arca Gold BUGS TR-1.9537.332.102.3430.1747.0520.42
    MCXL2X Index FTSEFTSE 250 MCXL2X1.2451.582.199.1723.4746.6120.36
    XAU Index NASDAQ OMX PSXPHILA GOLD & SILVER INDX-1.8636.731.262.6129.9845.7019.89
    SMILEP Index Six Swiss ExchangeSMI Daily Leverage Price1.3052.10-0.012.7314.0744.8215.40
    CACLV Index BloombergCAC 40 Leverage Index1.7245.90-1.17-0.2415.4343.3014.33
    D1AJ Index Deutsche BoerseLevDAX Index1.1747.41-0.94-0.4815.2340.9813.70
    LEVDAX Index Deutsche BoerseLevDAX Index1.1847.41-0.96-0.4715.2440.9813.70
    GDMNTR Index New York Stock Exchange (NYSE)NYSE Arca Gold MinersNTR-1.4529.670.560.0419.3739.4514.86
    DJRUSGR Index Standard & Poor'sDJ Russia GDR T$1.2544.980.82-3.1113.8338.9012.61
    UKXL3X Index FTSEFTSE 100 UKXL3X3.4137.11-3.71-4.081.4837.737.85
    SUNIDX Index Dow JonesMACGlbSolarEgyTR1.5555.072.572.256.8136.4812.03
    SOLBZLC Index Solactive (Structured SolutionSol Brazil Csmr Index1.6433.533.541.3516.1135.9514.24
    SXOR Index STOXXSTXE 600 Cn&Mt (EUR) NRt0.5933.971.191.4911.9135.7612.59

    Worst Indexes 1yr

    MLIndexnameyesterdayytdweek1month6months1yrRank
    SHRTDX3 Index Deutsche BoerseShortDAX x3 TR EUR-2.85-56.421.89-0.35-30.21-53.52-20.55
    BCOMNG Index BloombergBBG Natural Gas-0.87-33.075.53-17.21-13.62-52.28-19.40
    NQCINGER Index #N/A Field Not ApplicableNQCI Natural Gas ER-0.81-26.285.52-17.27-8.57-48.62-17.24
    CACDSH Index #N/A N/ACAC 40 DOUBLE SHORT GR-2.68-44.841.44-0.68-22.45-43.92-16.40
    SMISL Index Six Swiss ExchangeSMI Daily Short Leverage-2.03-42.581.63-2.74-15.94-39.58-14.16
    SHRTDAX2 Index Deutsche BoerseSHORTDAX X2 INDEX-2.05-42.131.45-0.20-21.28-39.40-14.86
    UKXI3X Index FTSEFTSE 100 UKXI3X-3.93-31.176.477.46-2.21-32.95-5.31
    STRQEN Index New York Stock Exchange (NYSE)STRATAQUANT ENERGY2.34-17.983.35-2.15-12.09-29.45-10.09
    SXNRS Index STOXXSTXE6IGSDSht (EUR)TR (GR)-1.41-30.030.04-2.23-15.12-29.03-11.59
    XTNGET Index BloombergCMCI NGas NYM Hdg EUR TR-0.69-22.923.82-10.26-11.69-28.66-11.70
    FMIBI1X Index FTSEFTSE MIB FMIBI1X-1.38-28.930.610.31-16.77-27.55-10.85
    SOLGLOIN Index Solactive (Structured SolutionSolactive Gl Oil Eq NR3.58-15.594.03-2.71-15.81-27.24-10.43
    XTNGCT Index #N/A Field Not ApplicableCMCI NGas NYM Hdg CHF TR-0.62-21.044.35-10.06-9.92-26.62-10.56
    IBEXDS Index Madrid Stock ExchangeIBEX 35 Double Short-3.45-29.35-0.53-0.51-11.84-26.37-9.81
    KRXMETEL Index KOSPI Stock MarketKRX MEDIA & TELECOM INDX1.30-23.30-1.23-1.95-9.05-26.00-9.56
    CTNGTR Index BloombergCMCI Nat Gas USD Tot Ret-0.25-18.173.47-10.02-8.38-24.59-9.88
    CHILE65 Index Bolsa de Comercio de SantiagoCHILE 65 INDEX0.66-21.977.59-2.90-17.44-23.93-9.17
    XTNGGT Index BloombergCMCI Natgas Hdg GBP TR-0.51-17.035.00-8.21-6.27-23.84-8.33
    MLPY Index CushingCushing MLP High Inc Idx1.12-16.44-1.00-10.34-24.19-23.49-14.75
    KRXSHIP Index KOSPI Stock MarketKRX Machinery & Equip1.05-20.16-1.03-5.00-6.74-22.93-8.93

    Latest ML Comics

    Rob is penetrating wrestling craft
    Rob is penetrating consumer discretionary sector
    Rob is penetrating consumer discretionary sector
    Markets have been rising on fears of attack on North Korea, then they were rising as the threat of North Korea risk off was less. After some huff and puff - Rob decided to try and raise some money for his future automotive engineering business.
    Initial Team
    4 Wheel drive and thoughts about business
    Rear Engine Transmission Shift Problem
    6 Wheeler in the Making
    Rob has a new plan

    Recent ML Rural Highlights. Small Towns and Villages

    Vaskoh-Romania
    Artvin-Turkey
    Gorishkino-Russia