image
Midlincoln Index Atlas October 10, 2019
If your are viewing this document on a mobile device click here to skip part with data and go directly to content part

Tockenising Midlincoln Crafts

This section contains links to materials about Midlincoln Rural Crafts Initiatives

Midlincoln is testing rural co-working model as its core business. Half of the co-working space is dedicated to investment analytics service and half of the space is industrial, creative environment with machines and tools which can be used in product development and small scale production.

Investing into Midlincoln Craft fund tokens is a comprehensive investment into all of the portfolio companies and funds. But each of the mentioned companies and funds are also accessible for investment directly also via tokens. Each of the portfolio company or a fund can be considered as a standalone franchise and Stoken could provide security token investment for qualified investors in any of them.

Midlincoln Research
Financials

Investment Research

View Midlincoln Research One Pager

Mount Maple
Souvenirs
Cons. Cyclicals

Consumer Cyclicals

View the souvenir producer one pager

Midlincoln
Craft Fund

Midlincoln Craft Fund

View Midlincoln Craft Fund Description

TamaraAvia
Automotive

Engineering

View intro for this automotive producer

Wrestling, Healthcare and
Entertainment

ITI RTS ETF Report

Read about wrestling craft business

Village Telecoms
and Media

Telecoms

Coming up and not ready yet

Small Scale
Energy

Energy

Coming up and not ready yet

Small Scale
Materials

Materials

Coming up and not ready yet

Verical Agri
and Food Production

Consumer Staples

Coming up and not ready yet

Heating, Water, Electrics
Installation and Repair

Utilities

Coming up and not ready yet

Home Electronics
Repair

technology

Coming up and not ready yet

Russian Macro
and
RTS vs. MSCI and RSX

ITI RTS ETF Report

View Russian Macro and RTS vs. MSCI Report

Russian
Domestic
Liquidity

RTS Future vs. ETF

View Russian Domestic Liquidity Report

ETFs on Moex
and
Abroad

RTS Future vs. ETF

View Russian ETF Industry Report

ITI Russian Eurobonds ETF

ITI Bonds ETF Report

View ITI Bonds ETF Report

ITI Funds
RTS Index
ETF

ITI RTS ETF Report

View ITI RTS ETF Report

RTS Futures
vs
RTS ETF

RTS Future vs. ETF

View Futures match price, and not TR Report

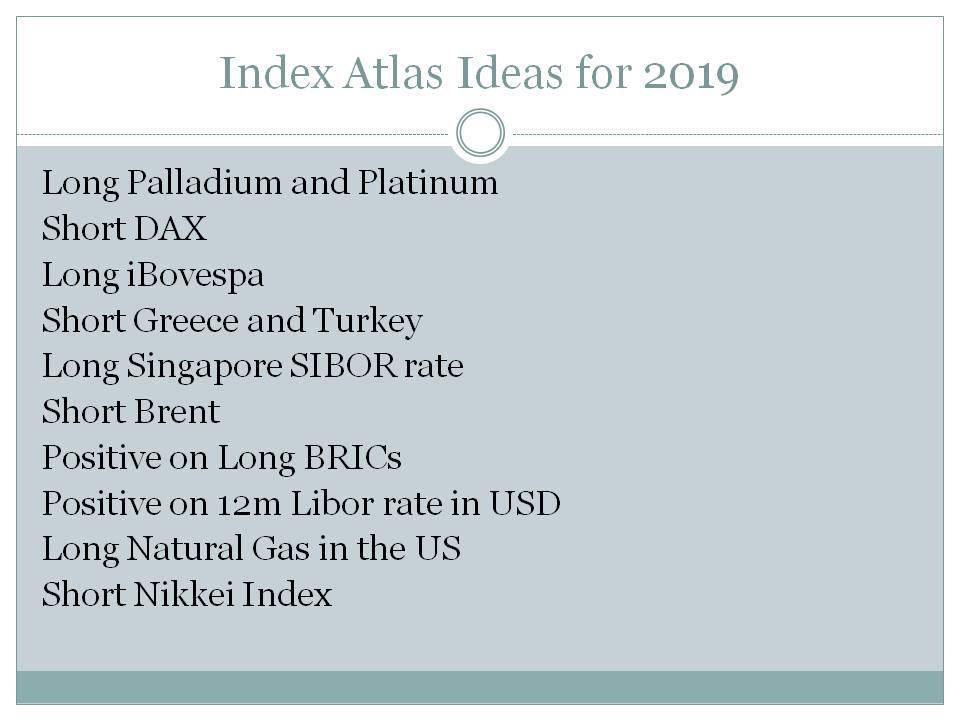
Top 20 Long Index Ideas YTD From Best to Worst

objectiveYTD
FRANCE32.98
RUSSIA30.91
PRECIOUS METAL SECTOR26.85
TECHNOLOGY22.78
TECHNOLOGY SECTOR22.05
GROWTH MID CAP20.72
NETHERLANDS20.52
UTILITIES20.38
NORTH AMERICAN REGION20.16
PREFERRED19.95
TARGET 2041-204519.95
NORTH AMERICAN REGION19.77
AGGRESSIVE ALLOCAT00004E4BION19.59
EVENT DRIVEN DIVERSIFIED19.59
MACRO SYSTEMATIC DIVERSIFIED19.59
MANAGED FUTURES CURRENCY19.59
MANAGED FUTURES DISCRETIONARY19.59
MANAGED FUTURES SYSTEMATIC19.59
MUNI CA INTERMEDIATE AND SHORT19.59
MUNI CALIFORNIA LONG19.59

Top 20 Short Index Ideas YTD From Best to Worst

objectiveYTD
EQUITY HEDGE DIVERSIFIED-10.07
AGRICULTURE-6.35
CHILE-6.15
POLAND-5.63
EQUITY HEDGE (FOHF)-5.48
EVENT DRIVEN SPECIAL SITUATION-4.25
FIXED INCOME ARBITRAGE-4.25
SPAIN-3.01
KOREA-1.59
D0A3YNAMIC ALLOCATION-0.88
ENHANCED MMKT (NON-US)-0.88
MACRO (FOHF)-0.88
SHORT BIASED-0.88
INDIA-0.21
MIDDLE EAST REGION0.37
AGGREGATE BOND EURO FOCUSED1.28
PERU1.32
FOREIGN AGGREGATE BOND1.65
FOREIGN A00001106GGREGATE BOND2.50
AGGREGATE BOND SHORT2.73

Combined Performance of Tracked Indexes by Index Provider Top 20 Winners

sourcenameytd
RTS Exchange30.63
NASDAQ OMX PSX28.24
Shenzhen Stock Exchange25.18
London Metal Exchange - LME23.2
Stuttgart Stock Exchange22.545
Cohen and Steers21.924999999999997
BOVESPA21.555
Russell Equity Indices20.78
Morningstar20.30363636363636
Thai Bond Market Association20.15
Market Vectors Index Solutions19.62
Russell19.610400000000002
Investment Trust19.47
Shanghai Stock Exchange19.33
New York Stock Exchange (NYSE)19.103
CRSP18.93
Tokyo Commodity Exchange18.13
NASDAQ Global Market18.122000000000003
Shanghai Gold Exchange Contrac17.68
Gold Traders Association of Th17.53

Combined Performance of Tracked Indexes by Index Provider Top 20 Losers

sourcenameytd
Diapason Commodities-44.13
Nigerian Stock Exchange-11.78
KOSPI Stock Market-10.393636363636363
Mauritius Stock Exchange-10.07
Bolsa de Comercio de Santiago-7.57
Teucrium-7.55
Bulgaria Stock Exchange-6.18
Merrill Lynch-5.24
WisdomTree-4.83
FNGuide Inc-4.509090909090909
National Stock Exchange of Ind-4.375
Colombo Stock Exchange-2.42
Statistics South Africa-2.16
Madrid Stock Exchange-2.1033333333333335
ProShares-1.99
Banco Central do Brasil-0.88
BSE India-0.63
Government Debt Management Age-0.41
The Association of Banks in Si-0.34
Saudi Arabian Stock Exchange0.37

Chart: Index Atlas

Index Strategy October 2019

Source:

Download All Slides in Power Point
  • CIBC announces no changes to the CIBC Atlas Clean Energy Index
  • Standardized atlas of the horse's brain produced by scientists
  • Valuation Metrics in Focus For Atlas Air Worldwide Holdings, Inc ...
  • Australia is rich, dumb and getting dumber
  • Barclays announces changes to the CIBC Atlas Select MLP Index
  • Atlas Air Worldwide Holdings (AAWW) Settles Into New 52-Week ...
  • A transgender woman was attacked in Portland. Police are ...

    Key Topics and News

    Combined Performance of Tracked Indexes by Index Provider Top Losers
    Combined Performance of Tracked Indexes by Index Provider Top Winners
    Top 20 Short Index Ideas YTD From Best to Worst
    Index Ideas YTD From Best to Worst

    Recent Index Atlas Ideas ChartArt

    Index Atlas

    Download file in Power Point
    Midlincoln Index Atlas

    Download file in Power Point
    Index Atlas

    Download file in Power Point
    A year with new methodology - RTS Industrials stocks getting replaced by consumer goods companies

    Download file in Power Point
    Index Atlas Trade Ideas for 2019

    Download file in Power Point
    Long Palladium and Platinum

    Download file in Power Point
    Short DAX

    Download file in Power Point
    Long iBovespa

    Download file in Power Point
    Short Greece and Turkey Index

    Download file in Power Point

    Index Rebalancing News

    MSCI

  • 'See Sensex at 43000 by March, MSCI index rebalancing will attract ...
  • MSCI rolls out new 'megatrend' equity indices
  • The chameleon effect: Why investors need to understand the indices ...
  • The art and science of stewarding the S&P 500
  • MSCI ESG RESEARCH: OVERVIEW AND PRODUCTS
  • MSCI ESG RESEARCH

    Standard & Poor's Index

  • The art and science of stewarding the S&P 500
  • Tortoise Announces Expected Constituent Changes Due to Merger ...
  • Cushing® Asset Management and Swank Capital Announce ...
  • Tortoise Announces Special Index Rebalances Due to Acquisition ...
  • The S&P 500® ESG Index: Integrating Environmental ... - S&P Global
  • analysis of the effects of pre announcement of s&p 500 index changes

    Hang Seng

  • Stocks blog: Hang Seng extends run of losses to six straight ...
  • Hang Seng Index rises to highest level in six weeks as trade war ...
  • Stocks Blog: Hang Seng ends as world's worst performing major ...
  • Form FWP ROYAL BANK OF CANADA Filed by: ROYAL BANK OF ...
  • (PDF) The Day-of-the-week Effect in the Hang Seng Index
  • (PDF) Modeling and forecasting Hang Seng index volatility with day ...

    FTSE

  • FTSE UK Index Series - FTSE Russell Research Portal
  • FTSE Frontier Index Series - FTSE Russell Research Portal

    Bloomberg Indices

  • Cushing® Asset Management and Swank Capital Announce ...
  • MSCI rolls out new 'megatrend' equity indices
  • AGF launches liquid alternative ETFs on TSX
  • The US-China relationship is worsening rapidly before talks
  • Bloomberg Indices | Bloomberg Professional Services | Bloomberg ...
  • Resources | Bloomberg Barclays | Bloomberg Indices

    Dow Jones

  • Stocks end lower after trade concerns rattle markets
  • S&P Dow Jones Indices Announces Changes to the S&P/TSX ...
  • Stocks just delivered a reminder about October's reputation for ...
  • Tortoise Announces Expected Constituent Changes Due to Merger ...
  • (PDF) The Dow Jones Industrial Average in the Twentieth Century ...
  • (PDF) Dynamics of the Dow Jones and the NASDAQ stock indexes

    Moex Indexes

  • COMMENT: Russian stocks dividends: you're simply the best, better ...
  • World indices
  • Bloomberg Rebalances Components of Dollar Index for 2016: Peso ...
  • Emerging Markets 'Under Pressure' After Fed Rate Hike: Inside EM
  • FactSheet - Moscow Exchange
  • MOEX Russia Total Return Indices — Moscow Exchange

    Index Futures Trading

  • MSCI Indexes - ICE
  • MSCI World Index Future | ICE
  • MSCI index derivatives: Introduction of 26 index ... - Eurex Exchange
  • S&P futures - Wikipedia
  • S&P futures - Wikipedia
  • Financial Futures Trading How Do S&P 500 Futures ... - Investopedia
  • Hang Seng Index Futures - HKEX
  • Hang Seng Index Futures - HKEX
  • Hang Seng Index Futures and Options - HKEX
  • FTSE 100 Index Future | ICE
  • FTSE Equity Index Futures - ICE
  • FTSE 100 Futures - Investing.com
  • Bloomberg Indices | Bloomberg Professional Services | Bloomberg ...
  • Futures - Bloomberg
  • Bloomberg Commodity Indexes - Eurex Exchange
  • Dow Jones Futures: Stock Market Rally Rocked As China Trade ...
  • Premarket Stock Trading - CNNMoney - Business - CNN.com
  • Pre-Market Data - CNBC.com
  • Indices - Moscow Exchange
  • Options and Futures Contracts Information — Moscow Exchange
  • IMOEX Quote - MOEX Russia Index - Bloomberg Markets

    Top 20 Index Longs Based on Momentum

    MLIndexnameweek1monthytd6months1yrRank
    JGOLD IndexFTSEFTSE/JSE AFRICA GOLD MNG-7.33-8.1449.9128.84112.8731.56
    NQCIPAER Index#N/A Field Not ApplicableNQCI Palladium ER3.6010.3234.072.1766.2920.60
    MUTFPALL IndexInvestment TrustMUFG TOCOM Palladium2.819.6524.34-0.6266.6119.61
    ICONBV IndexBOVESPABM&FBOVESPA Consumption2.04-1.1330.2716.8759.6319.35
    SOLBZLC IndexSolactive (Structured SolutionSol Brazil Csmr Index2.05-2.1525.0211.5565.1519.15
    TFTMIGMI IndexFTSEFTSE Gold Mines Index TR-2.19-4.3032.5124.9457.9919.11
    NTCCS4LV IndexNikkeiNikkei-TOCOM LV Gold-0.18-0.6733.5827.0949.3018.88
    DJRUSGR IndexStandard & Poor'sDJ Russia GDR T$3.8212.2737.9521.1337.9518.79
    PLDMLNPM IndexLondon Metal Exchange - LMELondon Metal Exchange Palladiu2.629.9526.220.0662.4118.76
    FTMIGMI IndexFTSEFTSE Gold Mines Index-2.26-4.6031.4024.2056.3318.42
    TTGDAR IndexStandard & Poor'sS&P/TSX Glob Gold TR Idx-2.29-4.2431.7123.3055.4118.04
    BCOMNI IndexBloombergBBG Nickel-3.637.5061.0030.9435.0317.46
    JCGMGGI IndexMarkitGlobal Mining Glob Gol-2.21-4.3331.1322.1953.9217.39
    MARUDR IndexMSCIMSCI Russia ADR/GDR NRE3.7611.9634.8718.1235.4217.32
    MSRC30NU IndexMSCIMSCI Russia 30% Capped T4.1712.6935.0817.3934.9417.30
    MSEURC$N IndexMSCIMSCI Russia Capped at Gr4.1712.6935.0817.3934.9417.30
    DXRN IndexDeutsche BoerseDAXgbl Russia EUR NR4.1012.9634.0619.2632.7117.26
    MSEURU$N IndexMSCIMSCI Russia 25-50 Index4.5413.1634.7817.4733.8317.25
    HUINTR IndexNew York Stock Exchange (NYSE)NYSE Arca Gold BUGS TR-1.42-2.8929.5621.4151.6617.19
    M1RUDR IndexMSCIMSCI RUSSIA ADR/GDR NR3.7311.7935.1618.1335.0217.17

    Top 20 Index Shorts Based on Momentum

    MLIndexnameweek1monthytd6months1yrRank
    NTCS11LV IndexNikkeiNikkei-TOCOM LV Cr Oil-5.264.3413.82-29.97-44.55-18.86
    SHRTDX3 IndexDeutsche BoerseShortDAX x3 TR EUR-4.32-19.91-46.44-25.79-24.57-18.65
    CACDSH Index#N/A N/ACAC 40 DOUBLE SHORT GR-1.07-11.72-38.59-18.31-25.57-14.17
    SHRTDAX2 IndexDeutsche BoerseSHORTDAX X2 INDEX-3.05-13.90-33.95-18.13-16.85-12.98
    SMISL IndexSix Swiss ExchangeSMI Daily Short Leverage1.55-6.45-36.10-15.53-31.26-12.92
    UKXI3X IndexFTSEFTSE 100 UKXI3X-2.92-7.13-35.02-16.28-23.34-12.42
    XTCTET Index#N/A Field Not ApplicableCMCI Cotton Hdg EUR TR5.202.83-19.21-20.34-29.90-10.55
    US0012M IndexICE Benchmark AdministrationICE LIBOR USD 12 Month6.206.41-31.14-26.44-28.14-10.49
    XTCTCT Index#N/A Field Not ApplicableCMCI Cotton Hdg CHF TR5.562.29-16.81-17.38-27.91-9.36
    FMIBI1X IndexFTSEFTSE MIB FMIBI1X-0.47-8.55-24.51-10.46-17.09-9.14
    FNGDSBLC IndexFNGuide IncFnGuide Inc MKF Star Bluechip1.578.38-16.41-16.36-29.96-9.09
    XTLAET IndexBloombergCMCI Hdg Ali EUR ER-0.91-1.44-10.39-13.01-19.57-8.73
    SXNRS IndexSTOXXSTXE6IGSDSht ?TR (GR)-1.20-8.51-24.72-12.25-12.46-8.61
    UKXI2X IndexFTSEFTSE 100 UKXI2X-1.73-4.00-24.77-12.26-16.15-8.54
    KRXMETEL IndexKOSPI Stock MarketKRX MEDIA & TELECOM INDX2.349.52-21.81-17.88-27.91-8.48
    SPSU6ET IndexStandard & Poor'sSP SC 600 Cap Enrgy TR12.4421.81-2.36-22.59-45.35-8.42
    XTSUET IndexBloombergCMCI Sugar#11 Hdg EUR TR2.23-4.26-12.84-17.13-14.42-8.40
    FNGDCDTI IndexFNGuide IncFnGuide Inc China Consumption2.958.97-15.50-21.64-23.25-8.24
    FNGDCOIN IndexFNGuide IncFnGuide Inc Consumer Index3.8312.45-16.63-22.63-26.57-8.23
    DWOTR IndexNew York Stock Exchange (NYSE)Dyn Oil Ser Intellidex T8.2221.71-0.62-22.21-40.08-8.09

    Best Indexes last Week

    MLIndexnameyesterdayytdweek1month6months1yrRank
    SOLGLOIN Index Solactive (Structured SolutionSolactive Gl Oil Eq NR13.686.1815.4526.80-8.12-32.260.47
    SPSU6ET Index Standard & Poor'sSP SC 600 Cap Enrgy TR10.67-2.3612.4421.81-22.59-45.35-8.42
    TTENAR Index Standard & Poor'sS&P/TSX CAP ENERGY TR IX9.4113.1612.3722.21-5.39-19.162.51
    BCOMRB Index BloombergBBG Unleaded Gasoline12.6838.3610.2716.289.02-8.356.81
    SPCPOGN Index Standard & Poor'sS&P CP O&G Expl&Prod NTR8.3211.189.9218.01-4.50-19.251.05
    SGECBRTR Index Standard & Poor's Index AlertS&P GSCI Enhanced Brent Crude14.2535.289.8618.316.53-5.407.32
    SPGCBRTR Index Standard & Poor's Index AlertS&P GSCI Brent Crude Official14.2535.509.8418.366.33-5.497.26
    SPOILH Index Standard & Poor'sS&P 500 Oil-hedged13.6357.319.7520.489.53-10.387.34
    BCOMCO Index BloombergBBG Brent Crude13.5530.539.0617.373.62-9.625.11
    STRQEN Index New York Stock Exchange (NYSE)STRATAQUANT ENERGY8.03-5.438.7617.62-16.32-35.73-6.42
    KRXCST Index KOSPI Stock MarketKRX CONSTRUCTIONS INDX4.66-14.998.7414.87-13.29-23.69-3.34
    BCOMPE Index BloombergBBG Petroleum13.0631.128.6115.623.77-9.764.56
    SPGSENTR Index Standard & Poor'sS&P GSCI Energy Tot Ret12.9332.228.5915.934.67-6.305.72
    BCOMCL Index BloombergBBG WTI Crude Oil14.3634.568.5615.163.83-10.964.15
    NQCICLER Index #N/A Field Not ApplicableNQCI Crude Oil ER14.3634.808.5614.623.63-11.363.86
    DBODIXX Index #N/A Field Not ApplicableDBLC Oil Exc Rtn Idx14.3634.828.5514.593.66-11.393.85
    SPGSCLTR Index Standard & Poor'sS&P GSCI Crude Oil T Ret14.3836.848.5314.694.62-9.474.59
    SPGSCLP Index Standard & Poor'sS&P GSCI Crude Oil ER14.3634.638.4914.503.48-11.553.73
    SPGCCLP Index Standard & Poor's Index AlertS&P GSCI Crude Oil Official Cl14.3634.638.4914.503.48-11.553.73
    XTXBCT Index #N/A Field Not ApplicableCMCI RBOB Gas Hdg CHF TR11.3628.018.4913.684.80-15.282.92

    Worst Indexes last Week

    MLIndexnameyesterdayytdweek1month6months1yrRank
    JGOLD Index FTSEFTSE/JSE AFRICA GOLD MNG0.1549.91-7.33-8.1428.84112.8731.56
    SHRTDX3 Index Deutsche BoerseShortDAX x3 TR EUR1.43-46.44-4.32-19.91-25.79-24.57-18.65
    XTLNET Index #N/A Field Not ApplicableCMCI Nickel Hdg EUR TR-2.8752.45-4.316.2925.3725.7513.28
    NZSEMC Index Standard & Poor'sS&P/NZX MidCap Index-1.038.95-4.11-0.332.878.831.82
    XTLNCT Index BloombergCMCI Nickel Hdg CHF TR-2.4056.73-3.975.6829.8129.1015.16
    BCOMNI Index BloombergBBG Nickel-2.0861.00-3.637.5030.9435.0317.46
    SHRTDAX2 Index Deutsche BoerseSHORTDAX X2 INDEX0.73-33.95-3.05-13.90-18.13-16.85-12.98
    UKXI3X Index FTSEFTSE 100 UKXI3X1.56-35.02-2.92-7.13-16.28-23.34-12.42
    SX3R Index STOXXSTXE 600 Fd&Bv (EUR) NRt-1.1725.07-2.85-1.778.2116.334.98
    SASEIDX Index Saudi Arabian Stock ExchangeTADAWUL ALL SHARE INDEX1.010.37-2.82-8.45-9.434.77-3.98
    DWTYTR Index NASDAQ Global MarketDorsey Wright TL Tech TR1.2934.42-2.61-8.795.345.34-0.18
    SPSHG Index Standard & Poor'sS&P GCC Comp Shariah0.631.20-2.52-5.70-6.163.62-2.69
    SPSHGT Index Standard & Poor'sS&P GCC Comp Shria TR0.634.63-2.51-5.67-3.607.28-1.12
    GDMNTR Index New York Stock Exchange (NYSE)NYSE Arca Gold MinersNTR1.5829.80-2.41-4.2621.4252.8316.90
    NDRUCSTA Index MSCIMSCI Daily TR Europe Net-1.5219.42-2.37-0.374.219.012.62
    TTGDAR Index Standard & Poor'sS&P/TSX Glob Gold TR Idx0.9231.71-2.29-4.2423.3055.4118.04
    FTMIGMI Index FTSEFTSE Gold Mines Index0.9831.40-2.26-4.6024.2056.3318.42
    JCGMGGI Index MarkitGlobal Mining Glob Gol1.0031.13-2.21-4.3322.1953.9217.39
    TFTMIGMI Index FTSEFTSE Gold Mines Index TR0.9832.51-2.19-4.3024.9457.9919.11
    ABTRPHIL Index iBoxxiBoxx ABF Philippines0.1019.82-2.17-2.0012.8624.648.33

    Best Indexes last Month

    MLIndexnameyesterdayytdweek1month6months1yrRank
    SOLGLOIN Index Solactive (Structured SolutionSolactive Gl Oil Eq NR13.686.1815.4526.80-8.12-32.260.47
    TTENAR Index Standard & Poor'sS&P/TSX CAP ENERGY TR IX9.4113.1612.3722.21-5.39-19.162.51
    KRXSHIP Index KOSPI Stock MarketKRX Machinery & Equip3.39-11.316.4022.04-9.73-21.16-0.61
    SPSU6ET Index Standard & Poor'sSP SC 600 Cap Enrgy TR10.67-2.3612.4421.81-22.59-45.35-8.42
    SPGSNGP Index Standard & Poor'sS&P GSCI Natural Gas ER2.71-7.003.9121.71-7.480.694.71
    DWOTR Index New York Stock Exchange (NYSE)Dyn Oil Ser Intellidex T7.28-0.628.2221.71-22.21-40.08-8.09
    RIEHNGTR Index NatWest/RBS - Cross AssetRICI Enh Natural Gas TR2.55-1.523.7121.46-7.795.265.66
    LEVDAX3 Index Deutsche BoerseLevDAX x3 TR EUR-2.7748.343.2521.3614.19-6.018.20
    NQCINGER Index #N/A Field Not ApplicableNQCI Natural Gas ER2.71-7.073.8121.14-7.58-0.164.30
    SPOILH Index Standard & Poor'sS&P 500 Oil-hedged13.6357.319.7520.489.53-10.387.34
    BCOMNG Index BloombergBBG Natural Gas2.71-12.823.7919.90-10.23-5.282.04
    FNGDASHP Index FNGuide IncFnGuide Inc Shipbuilding and T2.58-9.955.0519.87-11.81-11.680.36
    DWETR Index New York Stock Exchange (NYSE)Dyn En E&P Intellidex TR7.10-2.078.2918.67-13.53-34.72-5.32
    SPGCBRTR Index Standard & Poor's Index AlertS&P GSCI Brent Crude Official14.2535.509.8418.366.33-5.497.26
    SGECBRTR Index Standard & Poor's Index AlertS&P GSCI Enhanced Brent Crude14.2535.289.8618.316.53-5.407.32
    SPCPOGN Index Standard & Poor'sS&P CP O&G Expl&Prod NTR8.3211.189.9218.01-4.50-19.251.05
    STRQEN Index New York Stock Exchange (NYSE)STRATAQUANT ENERGY8.03-5.438.7617.62-16.32-35.73-6.42
    BCOMCO Index BloombergBBG Brent Crude13.5530.539.0617.373.62-9.625.11
    MCXL2X Index FTSEFTSE 250 MCXL2X-1.6731.794.6016.653.66-4.885.01
    KOSPI2LG Index KOSPI Stock MarketKOSPI200 Leverage IDX1.36-1.144.0616.61-11.58-23.85-3.69

    Worst Indexes last Month

    MLIndexnameyesterdayytdweek1month6months1yrRank
    SOLGLOIN Index Solactive (Structured SolutionSolactive Gl Oil Eq NR13.686.1815.4526.80-8.12-32.260.47
    TTENAR Index Standard & Poor'sS&P/TSX CAP ENERGY TR IX9.4113.1612.3722.21-5.39-19.162.51
    KRXSHIP Index KOSPI Stock MarketKRX Machinery & Equip3.39-11.316.4022.04-9.73-21.16-0.61
    SPSU6ET Index Standard & Poor'sSP SC 600 Cap Enrgy TR10.67-2.3612.4421.81-22.59-45.35-8.42
    SPGSNGP Index Standard & Poor'sS&P GSCI Natural Gas ER2.71-7.003.9121.71-7.480.694.71
    DWOTR Index New York Stock Exchange (NYSE)Dyn Oil Ser Intellidex T7.28-0.628.2221.71-22.21-40.08-8.09
    RIEHNGTR Index NatWest/RBS - Cross AssetRICI Enh Natural Gas TR2.55-1.523.7121.46-7.795.265.66
    LEVDAX3 Index Deutsche BoerseLevDAX x3 TR EUR-2.7748.343.2521.3614.19-6.018.20
    NQCINGER Index #N/A Field Not ApplicableNQCI Natural Gas ER2.71-7.073.8121.14-7.58-0.164.30
    SPOILH Index Standard & Poor'sS&P 500 Oil-hedged13.6357.319.7520.489.53-10.387.34
    BCOMNG Index BloombergBBG Natural Gas2.71-12.823.7919.90-10.23-5.282.04
    FNGDASHP Index FNGuide IncFnGuide Inc Shipbuilding and T2.58-9.955.0519.87-11.81-11.680.36
    DWETR Index New York Stock Exchange (NYSE)Dyn En E&P Intellidex TR7.10-2.078.2918.67-13.53-34.72-5.32
    SPGCBRTR Index Standard & Poor's Index AlertS&P GSCI Brent Crude Official14.2535.509.8418.366.33-5.497.26
    SGECBRTR Index Standard & Poor's Index AlertS&P GSCI Enhanced Brent Crude14.2535.289.8618.316.53-5.407.32
    SPCPOGN Index Standard & Poor'sS&P CP O&G Expl&Prod NTR8.3211.189.9218.01-4.50-19.251.05
    STRQEN Index New York Stock Exchange (NYSE)STRATAQUANT ENERGY8.03-5.438.7617.62-16.32-35.73-6.42
    BCOMCO Index BloombergBBG Brent Crude13.5530.539.0617.373.62-9.625.11
    MCXL2X Index FTSEFTSE 250 MCXL2X-1.6731.794.6016.653.66-4.885.01
    KOSPI2LG Index KOSPI Stock MarketKOSPI200 Leverage IDX1.36-1.144.0616.61-11.58-23.85-3.69

    Best Indexes YTD

    MLIndexnameyesterdayytdweek1month6months1yrRank
    SUNIDX Index Dow JonesMACGlbSolarEgyTR1.4762.762.780.7122.0742.3016.97
    BCOMNI Index BloombergBBG Nickel-2.0861.00-3.637.5030.9435.0317.46
    SPOILH Index Standard & Poor'sS&P 500 Oil-hedged13.6357.319.7520.489.53-10.387.34
    XTLNCT Index BloombergCMCI Nickel Hdg CHF TR-2.4056.73-3.975.6829.8129.1015.16
    XTLNET Index #N/A Field Not ApplicableCMCI Nickel Hdg EUR TR-2.8752.45-4.316.2925.3725.7513.28
    JGOLD Index FTSEFTSE/JSE AFRICA GOLD MNG0.1549.91-7.33-8.1428.84112.8731.56
    LEVDAX3 Index Deutsche BoerseLevDAX x3 TR EUR-2.7748.343.2521.3614.19-6.018.20
    FMIBL2X Index FTSEFTSE MIB FMIBL2X-2.5543.55-0.7115.636.608.037.39
    TFMIBL2E Index FTSEFTSE MIB Leverag TR EUR-2.5543.55-0.7115.636.608.037.39
    CACGL Index #N/A Field Not ApplicableCAC 40 Leverage GR-2.5240.90-0.0510.669.728.617.23
    DXS Index BloombergSPADE DEFENSE INDEX1.0739.132.374.6619.6812.989.92
    CACTL Index Euronext ParisCAC 40 LEVERAGE NR-2.5238.53-0.0510.667.996.466.27
    SMILEP Index Six Swiss ExchangeSMI Daily Leverage Price-1.7338.39-1.953.6011.3219.278.06
    BCOMRB Index BloombergBBG Unleaded Gasoline12.6838.3610.2716.289.02-8.356.81
    DJRUSGR Index Standard & Poor'sDJ Russia GDR T$2.5137.953.8212.2721.1337.9518.79
    SPGSCLTR Index Standard & Poor'sS&P GSCI Crude Oil T Ret14.3836.848.5314.694.62-9.474.59
    DWCTR Index New York Stock Exchange (NYSE)Dynamic BLG&C Intellidex-0.1036.572.025.0420.065.288.10
    SPGCBRTR Index Standard & Poor's Index AlertS&P GSCI Brent Crude Official14.2535.509.8418.366.33-5.497.26
    DZETR Index New York Stock Exchange (NYSE)Dyn SemiCon Intellidex T-0.6435.361.466.4713.2112.148.32
    SGECBRTR Index Standard & Poor's Index AlertS&P GSCI Enhanced Brent Crude14.2535.289.8618.316.53-5.407.32

    Worst Indexes YTD

    MLIndexnameyesterdayytdweek1month6months1yrRank
    SHRTDX3 Index Deutsche BoerseShortDAX x3 TR EUR1.43-46.44-4.32-19.91-25.79-24.57-18.65
    CACDSH Index #N/A N/ACAC 40 DOUBLE SHORT GR1.19-38.59-1.07-11.72-18.31-25.57-14.17
    SMISL Index Six Swiss ExchangeSMI Daily Short Leverage1.35-36.101.55-6.45-15.53-31.26-12.92
    UKXI3X Index FTSEFTSE 100 UKXI3X1.56-35.02-2.92-7.13-16.28-23.34-12.42
    SHRTDAX2 Index Deutsche BoerseSHORTDAX X2 INDEX0.73-33.95-3.05-13.90-18.13-16.85-12.98
    US0012M Index ICE Benchmark AdministrationICE LIBOR USD 12 Month1.00-31.146.206.41-26.44-28.14-10.49
    UKXI2X Index FTSEFTSE 100 UKXI2X0.93-24.77-1.73-4.00-12.26-16.15-8.54
    SXNRS Index STOXXSTXE6IGSDSht ?TR (GR)0.29-24.72-1.20-8.51-12.25-12.46-8.61
    FMIBI1X Index FTSEFTSE MIB FMIBI1X0.27-24.51-0.47-8.55-10.46-17.09-9.14
    IBEXDS Index Madrid Stock ExchangeIBEX 35 Double Short1.20-22.23-1.48-9.31-2.64-12.06-6.37
    KRXMETEL Index KOSPI Stock MarketKRX MEDIA & TELECOM INDX0.93-21.812.349.52-17.88-27.91-8.48
    MXEUSHRT Index MSCIMSCI EUROPE Short EUR-0.12-21.01-1.43-6.23-9.04-14.76-7.87
    SHORTDAX Index Deutsche BoerseSHORTDAX Index0.04-19.79-1.79-7.55-10.57-10.45-7.59
    XTCTET Index #N/A Field Not ApplicableCMCI Cotton Hdg EUR TR-0.29-19.215.202.83-20.34-29.90-10.55
    MCXI1X Index FTSEFTSE 250 MCXI1X0.35-16.90-1.34-4.40-10.67-6.71-5.78
    XTCTCT Index #N/A Field Not ApplicableCMCI Cotton Hdg CHF TR0.18-16.815.562.29-17.38-27.91-9.36
    FNGDCOIN Index FNGuide IncFnGuide Inc Consumer Index1.68-16.633.8312.45-22.63-26.57-8.23
    FNGDSBLC Index FNGuide IncFnGuide Inc MKF Star Bluechip0.95-16.411.578.38-16.36-29.96-9.09
    FNGDCDTI Index FNGuide IncFnGuide Inc China Consumption1.26-15.502.958.97-21.64-23.25-8.24
    KRXCST Index KOSPI Stock MarketKRX CONSTRUCTIONS INDX4.66-14.998.7414.87-13.29-23.69-3.34

    Best Indexes 1yr

    MLIndexnameyesterdayytdweek1month6months1yrRank
    JGOLD Index FTSEFTSE/JSE AFRICA GOLD MNG0.1549.91-7.33-8.1428.84112.8731.56
    NQCIPAER Index #N/A Field Not ApplicableNQCI Palladium ER-0.5434.073.6010.322.1766.2920.60
    SOLBZLC Index Solactive (Structured SolutionSol Brazil Csmr Index-0.3225.022.05-2.1511.5565.1519.15
    PLDMLNPM Index London Metal Exchange - LMELondon Metal Exchange Palladiu0.1926.222.629.950.0662.4118.76
    ICONBV Index BOVESPABM&FBOVESPA Consumption0.0830.272.04-1.1316.8759.6319.35
    TFTMIGMI Index FTSEFTSE Gold Mines Index TR0.9832.51-2.19-4.3024.9457.9919.11
    FTMIGMI Index FTSEFTSE Gold Mines Index0.9831.40-2.26-4.6024.2056.3318.42
    SOLBRAZ Index Solactive (Structured SolutionSol Brazil Mid Cap Index0.1424.272.17-1.188.8756.1316.50
    MSLUBRZ Index MSCIBrazil-1.5817.001.14-1.954.3555.5914.78
    TTGDAR Index Standard & Poor'sS&P/TSX Glob Gold TR Idx0.9231.71-2.29-4.2423.3055.4118.04
    JCGMGGI Index MarkitGlobal Mining Glob Gol1.0031.13-2.21-4.3322.1953.9217.39
    GDMNTR Index New York Stock Exchange (NYSE)NYSE Arca Gold MinersNTR1.5829.80-2.41-4.2621.4252.8316.90
    HUINTR Index New York Stock Exchange (NYSE)NYSE Arca Gold BUGS TR1.5429.56-1.42-2.8921.4151.6617.19
    MN40BRU Index MSCIMSCI Brazil 10/40 Idx Ne-0.3114.730.981.570.4644.3211.83
    IBX Index BOVESPABRAZIL IBrX INDEX-0.3912.840.641.20-1.0943.0310.95
    XAU Index NASDAQ OMX PSXPHILA GOLD & SILVER INDX1.2528.24-1.61-2.4017.9543.0114.24
    SUNIDX Index Dow JonesMACGlbSolarEgyTR1.4762.762.780.7122.0742.3016.97
    USIBOV Index B3 S.A. - Brasil, Bolsa, BalcaBovespa Brazil Ibovespa USD-0.4511.840.221.50-1.9540.8410.15
    DJRUSGR Index Standard & Poor'sDJ Russia GDR T$2.5137.953.8212.2721.1337.9518.79
    MARUDR Index MSCIMSCI Russia ADR/GDR NRE2.5534.873.7611.9618.1235.4217.32

    Worst Indexes 1yr

    MLIndexnameyesterdayytdweek1month6months1yrRank
    SPSU6ET Index Standard & Poor'sSP SC 600 Cap Enrgy TR10.67-2.3612.4421.81-22.59-45.35-8.42
    DWOTR Index New York Stock Exchange (NYSE)Dyn Oil Ser Intellidex T7.28-0.628.2221.71-22.21-40.08-8.09
    STRQEN Index New York Stock Exchange (NYSE)STRATAQUANT ENERGY8.03-5.438.7617.62-16.32-35.73-6.42
    DWETR Index New York Stock Exchange (NYSE)Dyn En E&P Intellidex TR7.10-2.078.2918.67-13.53-34.72-5.32
    SOLGLOIN Index Solactive (Structured SolutionSolactive Gl Oil Eq NR13.686.1815.4526.80-8.12-32.260.47
    SMISL Index Six Swiss ExchangeSMI Daily Short Leverage1.35-36.101.55-6.45-15.53-31.26-12.92
    DWENTR Index NASDAQ Global MarketDorsey Wright TL En TR6.052.067.5916.53-10.99-30.83-4.42
    FNGDSBLC Index FNGuide IncFnGuide Inc MKF Star Bluechip0.95-16.411.578.38-16.36-29.96-9.09
    XTCTET Index #N/A Field Not ApplicableCMCI Cotton Hdg EUR TR-0.29-19.215.202.83-20.34-29.90-10.55
    US0012M Index ICE Benchmark AdministrationICE LIBOR USD 12 Month1.00-31.146.206.41-26.44-28.14-10.49
    KRXMETEL Index KOSPI Stock MarketKRX MEDIA & TELECOM INDX0.93-21.812.349.52-17.88-27.91-8.48
    XTCTCT Index #N/A Field Not ApplicableCMCI Cotton Hdg CHF TR0.18-16.815.562.29-17.38-27.91-9.36
    FNGDCOIN Index FNGuide IncFnGuide Inc Consumer Index1.68-16.633.8312.45-22.63-26.57-8.23
    CACDSH Index #N/A N/ACAC 40 DOUBLE SHORT GR1.19-38.59-1.07-11.72-18.31-25.57-14.17
    FNGDKE30 Index FNGuide IncFnGuide Inc MKF KOSDAQ ELITE300.94-9.831.247.99-13.28-25.01-7.27
    SHRTDX3 Index Deutsche BoerseShortDAX x3 TR EUR1.43-46.44-4.32-19.91-25.79-24.57-18.65
    KOSPI2LG Index KOSPI Stock MarketKOSPI200 Leverage IDX1.36-1.144.0616.61-11.58-23.85-3.69
    KRXCST Index KOSPI Stock MarketKRX CONSTRUCTIONS INDX4.66-14.998.7414.87-13.29-23.69-3.34
    UKXI3X Index FTSEFTSE 100 UKXI3X1.56-35.02-2.92-7.13-16.28-23.34-12.42
    FNGDCDTI Index FNGuide IncFnGuide Inc China Consumption1.26-15.502.958.97-21.64-23.25-8.24

    Latest ML Comics

    Rob is penetrating wrestling craft
    Rob is penetrating consumer discretionary sector
    Rob is penetrating consumer discretionary sector
    Markets have been rising on fears of attack on North Korea, then they were rising as the threat of North Korea risk off was less. After some huff and puff - Rob decided to try and raise some money for his future automotive engineering business.
    Initial Team
    4 Wheel drive and thoughts about business
    Rear Engine Transmission Shift Problem
    6 Wheeler in the Making
    Rob has a new plan

    Recent ML Rural Highlights. Small Towns and Villages

    Vaskoh-Romania
    Artvin-Turkey
    Gorishkino-Russia