
Rusal reports good set of numbers for Q1 2018 but they are irrelevant to the current situation of the company
Rusal reports good set of numbers for Q1 2018 but they are irrelevant to the current situation of the comp
Rusal 1Q 2018 of 2.7$bn reflects higher revenue – reflecting growth in aluminium price and small increase in aluminium output to 931mt. Revenue grew by 19.5% in 1Q 2018 vs the same period last year.
EBITDA margin was flat at 20.8% despite growing aluminium price. EBITDA increased to 572$mln in line with growing revenue.
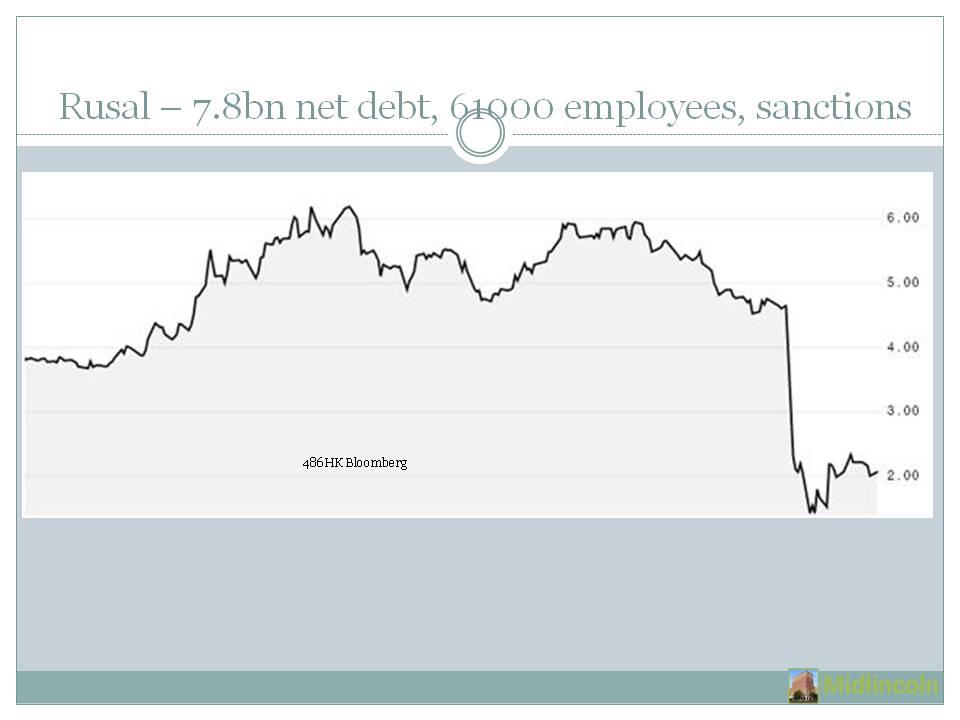
Net debt increased to 7.8bn$ growing by 3%, but interest expense was smaller than last year at 123mn$
Operating cash flow was less at 116mn$ representing a drop of 46% vs. the same period last year.
Adjusted net profit (ex Norilsk) grew in line to 317mn$.
Sanctions make Rusal outlook uncertain. It would have been further helped by weaker ruble but it is largely irrelevant now.
It will be unable to dispose of any assets under sanctions regime. It looks as if its future depends solely on the Russian government support.
There is also a more cruel Yukos like option on the cards if the government does not decide not to help. This will allow the creditors to get some cash out of Rusal without violating sanctions regime.
So far the government statements implied that Rusal will receive support. So share price bounced 33% from its trough.
Rusal 1Q 2018 of 2.7$bn reflects higher revenue – reflecting growth in aluminium price and small increase in aluminium output to 931mt. Revenue grew by 19.5% in 1Q 2018 vs the same period last year.
EBITDA margin was flat at 20.8% despite growing aluminium price. EBITDA increased to 572$mln in line with growing revenue.
Net debt increased to 7.8bn$ growing by 3%, but interest expense was smaller than last year at 123mn$
Operating cash flow was less at 116mn$ representing a drop of 46% vs. the same period last year.
Adjusted net profit (ex Norilsk) grew in line to 317mn$.
Sanctions make Rusal outlook uncertain. It would have been further helped by weaker ruble but it is largely irrelevant now.
It will be unable to dispose of any assets under sanctions regime. It looks as if its future depends solely on the Russian government support.
There is also a more cruel Yukos like option on the cards if the government does not decide not to help. This will allow the creditors to get some cash out of Rusal without violating sanctions regime.
So far the government statements implied that Rusal will receive support. So share price bounced 33% from its trough.
Singapore traded Nobel Group
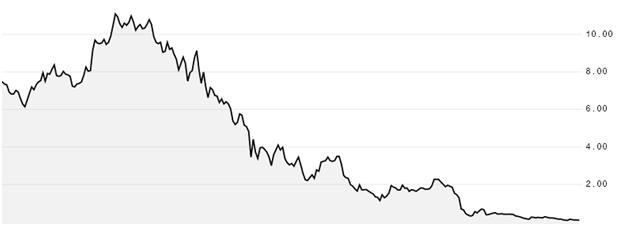
Though Rusal speculatively very attractive. There are far more attractive speculative opportunities in the sector. Singapore commodities traded The Nobel Group which lost 99% of its value in the last few years and with bonds in default may benefit from aluminium price surge which increases valuation of its Jamaican aluminium smelter.
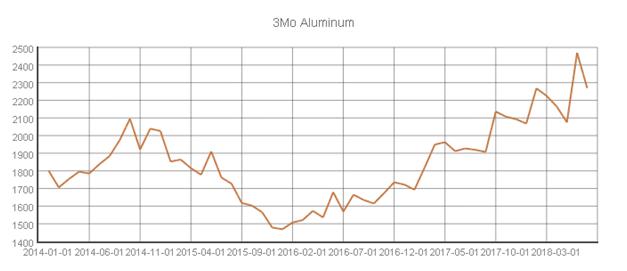
Aluminium price LME
News
Top Headlines
- Deripaska Feud With Old Rival Revived in London Court Hearing
- Aluminum's Turmoil Hands a Lifeline to Embattled Noble Group
- Aluminium shares may tag fundamentals more closely as sanctions ...
- Billionaire Deripaska Is Said to Plan to Keep Hands on Rusal
- Mnuchin Gives Rusal Sanctions Escape Route After Market Tumult
Anual Revenue
- United Company RUSAL Plc: Overseas Regulatory Announcement ...
- United Company RUSAL Plc: Results Announcement for the Three ...
- Global Chiral Material Market Analysis 2018 WR Grace & Co, United ...
- Rusal May Lose Aluminum Sales From Arconic, Ball in Russia
- Deripaska Feud With Old Rival Revived in London Court Hearing
Anual Profit
- United Company RUSAL Plc: Overseas Regulatory Announcement ...
- United Company RUSAL Plc: Results Announcement for the Three ...
- Sanctions impact casts shadow over Rusal profit jump
- Global Chiral Material Market Analysis 2018 WR Grace & Co, United ...
- Deripaska Feud With Old Rival Revived in London Court Hearing
EBITDA
- United Company RUSAL Plc: Results Announcement for the Three ...
- Deripaska Feud With Old Rival Revived in London Court Hearing
- Mnuchin Says US Isn't Looking to Put Rusal Out of Business
- RUSAL announced results for three months ended March 2018
- Constellium Reports First Quarter 2018 Results
Production
- A $3 Billion Aluminum Stash Is Now in Limbo After Sanctions
- US extends deadline for Rusal sanctions, aluminum prices dive
- How US Sanctions on Russian Aluminum Shook Markets
- Four Ways Rusal's Sanctions May Play Out in Aluminum Markets
- Top Rusal trader quits over US sanctions
Acquisitions
- United Company RUSAL Plc: Results Announcement for the Three ...
- Metal Markets Regain Equilibrium as Aluminum Supply Worries Ease
- Deripaska Offers to Cut En+ Stake in Bid for Sanctions Relief
- United States: OFAC Issues Updated General Licenses Clarifying ...
- Russia's Sanctioned Companies Seek $1.6 Billion in State Support
Results
Important Reports
United Co RUSAL PLC Presentation
Select Equity Data Snapshot
Historic and Consesus Forecast numbers from Bloomberg USD mn
United Co RUSAL PLC, , Materials
Fundamentals
| Year | 2013 | 2014 | 2015 | 2016 | 2017 | 2018 | 2019 |
|---|---|---|---|---|---|---|---|
| Revenue | 9,357.00 | 8,680.00 | 7,983.00 | 9,969.00 | 10,638.13 | 10,889.75 | 11,173.40 |
| Year | 2013 | 2014 | 2015 | 2016 | 2017 | 2018 | 2019 |
|---|---|---|---|---|---|---|---|
| Operating Profit | 942.00 | 1,409.00 | 1,068.00 | 1,523.00 | 1,778.75 | 1,839.00 | 1,763.00 |
| Year | 2013 | 2014 | 2015 | 2016 | 2017 | 2018 | 2019 |
|---|---|---|---|---|---|---|---|
| PTP | 147.00 | 763.00 | 1,354.00 | 1,288.00 | 2,181.88 | 2,265.63 | 2,414.80 |
| Year | 2013 | 2014 | 2015 | 2016 | 2017 | 2018 | 2019 |
|---|---|---|---|---|---|---|---|
| Net Income | 293.00 | 1,097.00 | 1,257.00 | 1,222.00 | 1,926.50 | 1,999.88 | 1,939.00 |
| Year | 2013 | 2014 | 2015 | 2016 | 2017 | 2018 | 2019 |
|---|---|---|---|---|---|---|---|
| EPS | 0.02 | 0.07 | 0.08 | 0.08 | 0.11 | 0.12 | 0.12 |
| Year | 2013 | 2014 | 2015 | 2016 | 2017 | 2018 | 2019 |
|---|---|---|---|---|---|---|---|
| DPS | 0.02 | 0.02 | 0.02 | 0.02 | 0.03 | 0.03 | 0.03 |
| Year | 2013 | 2014 | 2015 | 2016 | 2017 | 2018 | 2019 |
|---|---|---|---|---|---|---|---|
| EBITDA | 1,401.00 | 1,866.00 | 1,521.00 | 2,011.00 | 2,371.00 | 2,431.29 | 2,438.40 |
| Year | 2013 | 2014 | 2015 | 2016 | 2017 | 2018 | 2019 |
|---|---|---|---|---|---|---|---|
| BPS | 0.15 | 0.09 | 0.22 | 0.29 | 0.38 | 0.48 | 0.73 |
| Year | 2013 | 2014 | 2015 | 2016 | 2017 | 2018 | 2019 |
|---|---|---|---|---|---|---|---|
| Capex | -465.00 | -510.00 | -558.00 | -822.00 | -750.86 | -733.00 | -712.25 |
| Year | 2013 | 2014 | 2015 | 2016 | 2017 | 2018 | 2019 |
|---|---|---|---|---|---|---|---|
| FCF | 1,210.00 | 1,318.00 | 587.00 | 1,201.00 | 1,345.78 | 1,591.53 | 2,022.49 |
Growth
| Year | 2014 | 2015 | 2016 | 2017 | 2018 | 2019 |
|---|---|---|---|---|---|---|
| revenue Growth | -7.2% | -8.0% | 24.9% | 6.7% | 2.4% | 2.6% |
| Year | 2014 | 2015 | 2016 | 2017 | 2018 | 2019 |
|---|---|---|---|---|---|---|
| Operating Profit Growth | 49.6% | -24.2% | 42.6% | 16.8% | 3.4% | -4.1% |
| Year | 2014 | 2015 | 2016 | 2017 | 2018 | 2019 |
|---|---|---|---|---|---|---|
| PTP Growth | 419.0% | 77.5% | -4.9% | 69.4% | 3.8% | 6.6% |
| Year | 2014 | 2015 | 2016 | 2017 | 2018 | 2019 |
|---|---|---|---|---|---|---|
| Net Income Growth | 274.4% | 14.6% | -2.8% | 57.7% | 3.8% | -3.0% |
| Year | 2014 | 2015 | 2016 | 2017 | 2018 | 2019 |
|---|---|---|---|---|---|---|
| EPS Growth | 278.9% | 15.5% | -3.8% | 38.8% | 5.4% | 2.6% |
| Year | 2014 | 2015 | 2016 | 2017 | 2018 | 2019 |
|---|---|---|---|---|---|---|
| DPS Growth | 2.8% | 0.0% | 19.7% | 26.9% | 4.0% | 11.5% |
| Year | 2014 | 2015 | 2016 | 2017 | 2018 | 2019 |
|---|---|---|---|---|---|---|
| EBITDA Growth | 33.2% | -18.5% | 32.2% | 17.9% | 2.5% | 0.3% |
| Year | 2014 | 2015 | 2016 | 2017 | 2018 | 2019 |
|---|---|---|---|---|---|---|
| BPS Growth | -37.8% | 137.2% | 34.7% | 30.6% | 26.2% | 50.6% |
| Year | 2014 | 2015 | 2016 | 2017 | 2018 | 2019 |
|---|---|---|---|---|---|---|
| Net Incom GAAP Growth | 0.0% | 111.3% | 3.6% | 59.7% | 4.5% | 7.3% |
| Year | 2014 | 2015 | 2016 | 2017 | 2018 | 2019 |
|---|---|---|---|---|---|---|
| Capex Growth | 9.7% | 9.4% | 47.3% | -8.7% | -2.4% | -2.8% |
| Year | 2014 | 2015 | 2016 | 2017 | 2018 | 2019 |
|---|---|---|---|---|---|---|
| FCF Growth | 8.9% | -55.5% | 104.6% | 12.1% | 18.3% | 27.1% |
Ratios
| Year | 2013 | 2014 | 2015 | 2016 | 2017 | 2018 | 2019 |
|---|---|---|---|---|---|---|---|
| PE RATIO | 2.00 | 2.00 | 1.00 |
| Year | 2017 | 2018 | 2019 |
|---|---|---|---|
| BEST CURRENT EV BEST EBIT | 6.00 | 6.00 | 6.00 |
| Year | 2013 | 2014 | 2015 | 2016 | 2017 | 2018 | 2019 |
|---|---|---|---|---|---|---|---|
| EV/EBITDA | 4.00 | 4.00 | 4.00 |
| Year | 2013 | 2014 | 2015 | 2016 | 2017 | 2018 | 2019 |
|---|---|---|---|---|---|---|---|
| DIVIDEND YIELD | 10.00 | 11.00 | 13.00 |
| Year | 2013 | 2014 | 2015 | 2016 | 2017 | 2018 | 2019 |
|---|---|---|---|---|---|---|---|
| GROSS MARGIN | 30.00 | 29.00 | 27.00 |
| Year | 2013 | 2014 | 2015 | 2016 | 2017 | 2018 | 2019 |
|---|---|---|---|---|---|---|---|
| ROA | 11.00 | 12.00 | 11.00 |
| Year | 2013 | 2014 | 2015 | 2016 | 2017 | 2018 | 2019 |
|---|---|---|---|---|---|---|---|
| ROE | 33.00 | 28.00 | 22.00 |
| Year | 2013 | 2014 | 2015 | 2016 | 2017 | 2018 | 2018 | 2019 |
|---|---|---|---|---|---|---|---|---|
| EBITDA Margin | 22.00 | 0.00 | 22.00 | 21.00 |
| Year | 2017 |
|---|---|
| Market Cap | 3,948.00 |
| Year | 2017 |
|---|---|
| Number of Employees | 61,138.00 |
| Year | 2018 |
|---|---|
| 1 month return | -58.00 |
| Year | 2018 |
|---|---|
| 6 month return | -62.00 |
Key Info
United Co RUSAL PLC Web - www.rusal.ru
Tel - 7-495-720-51-70
Next Reporting Date - 14.05.2018