Top 20 Long Index Ideas YTD From Best to Worst
| objective | YTD |
| THAILAND | 11.00 |
| MIDDLE EAST REGION | 9.82 |
| MENA | 7.93 |
| RUSSIA | 6.95 |
| BRAZIL | 6.69 |
| EQUITY HEDGE DIVERSIFIED | 6.16 |
| FINLAND | 6.15 |
| TAIWAN | 5.87 |
| GCC | 5.12 |
| ITALY | 4.86 |
| MULTI STRATEGY (FOHF) | 4.54 |
| SINGAPORE | 4.09 |
| EQUITY HEDGE (FOHF) | 3.47 |
| AGRICULTURE | 3.16 |
| TECHNOLOGY | 3.05 |
| GREATER CHINA | 2.90 |
| NORWAY | 2.89 |
| PERU | 2.82 |
| FOREIGN A00001106GGREGATE BOND | 2.81 |
| EVENT DRIVEN SPECIAL SITUATION | 2.81 |
Top 20 Short Index Ideas YTD From Best to Worst
| objective | YTD |
| PHILIPPINES | -10.55 |
| INDONESIA | -6.40 |
| UTILITIES | -6.28 |
| POLAND | -6.15 |
| TURKEY | -6.11 |
| CANADA | -5.86 |
| PRECIOUS METAL SECTOR | -5.80 |
| PREFERRED | -5.47 |
| TARGET 2041-2045 | -5.47 |
| CONSUMER STAPLES | -5.37 |
| VALUE MID CAP | -5.14 |
| MATERIALS | -4.85 |
| FRANCE | -4.69 |
| TARGET 2021-2025 | -4.58 |
| TARGET 2031-2035 | -4.58 |
| REAL ESTATE | -4.47 |
| NATURAL RESOURCES SECTOR | -4.36 |
| INDUSTRIAL METALS | -4.34 |
| COMMUNICATIONS SECTOR | -3.97 |
| FINANCIAL | -3.72 |
Combined Performance of Tracked Indexes by Index Provider Top 20 Winners
| sourcename | ytd |
| Bermuda Stock Exchange | 15.08 |
| NASDAQ OMX Iceland | 12.57 |
| ICE Benchmark Administration | 11.146666666666667 |
| Johannesburg Stock Exchange | 9.95 |
| Sao Paulo Stock Exchange - SAO | 9.87 |
| Saudi Arabian Stock Exchange | 9.82 |
| Bovespa Bolsa de Valores de Sa | 9.11 |
| Prague Stock Exchange | 6.94 |
| Nigerian Stock Exchange | 6.74 |
| RTS Exchange | 6.27 |
| Statistics South Africa | 6.22 |
| Mauritius Stock Exchange | 6.16 |
| Taiwan Stock Exchange | 4.925 |
| AlphaShares | 4.01 |
| Thai Bond Market Association | 3.86 |
| Kuwait Stock Exchange | 3.83 |
| Shanghai Gold Exchange Contrac | 3.14 |
| Nikkei | 2.9324999999999997 |
| Anbima | 2.91 |
| Bolsa de Valores de Colombia | 2.86 |
Combined Performance of Tracked Indexes by Index Provider Top 20 Losers
| sourcename | ytd |
| Cushing | -13.27 |
| Market Vectors Index Solutions | -13.24 |
| National Stock Exchange of Ind | -9.705 |
| Stuttgart Stock Exchange | -8.725000000000001 |
| NASDAQ OMX PSX | -6.56 |
| Istanbul Stock Exchange | -6.24 |
| Cohen and Steers | -6.045 |
| WisdomTree | -5.995 |
| Teucrium | -5.6000000000000005 |
| Chicago Board Options Exchange | -5.495 |
| BSE India | -4.4 |
| NYSE Euronext Paris | -4.39 |
| CQG | -3.96 |
| SIX AB | -3.62 |
| The Association of Banks in Si | -3.6 |
| Euromoney | -3.56 |
| New York Stock Exchange (NYSE) | -3.3978947368421055 |
| Zacks | -3.36 |
| Euromoney Indices | -3.15 |
| S-Network Global Indexes LLC | -2.59 |
Chart: Which is the best index for Russia?RTS Index universe reflects on all IPOs on MOEX  Source: ML Download file in Power PointRecent Index Atlas Ideas ChartArtIndex Rebalancing NewsMSCI Standard & Poor's Index Hang Seng FTSE Bloomberg Indices Dow Jones Index Futures TradingTop 20 Index Longs Based on Momentum
Top 20 Index Shorts Based on Momentum
Best Indexes last Week
Worst Indexes last Week
Best Indexes last Month
Worst Indexes last Month
Best Indexes YTD
Worst Indexes YTD
Best Indexes 1yr
Worst Indexes 1yr
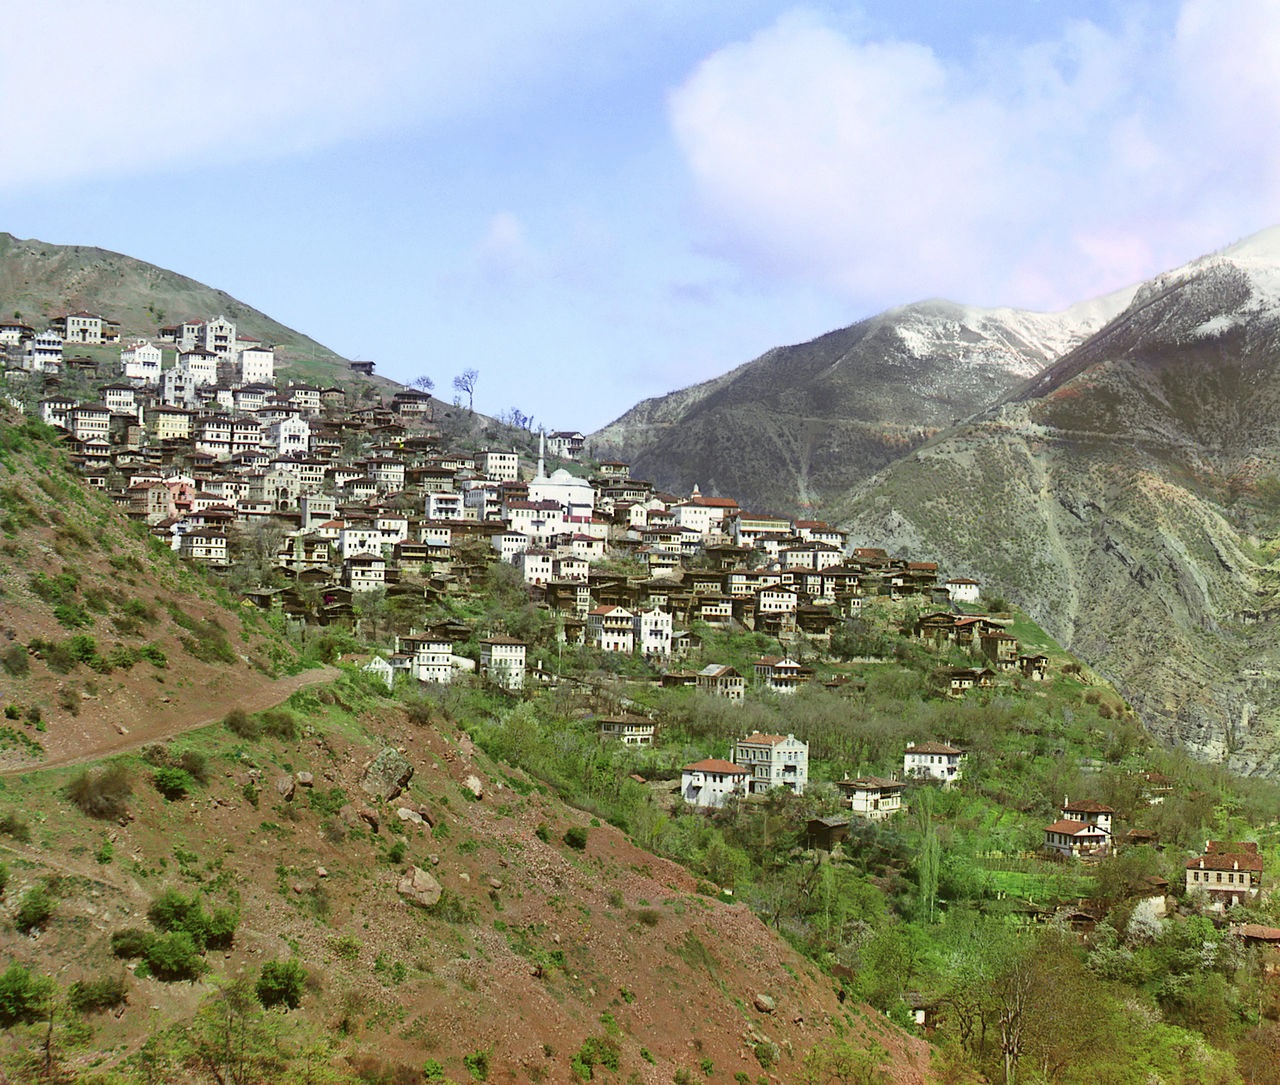
Latest ML ComicsRecent ML Rural Highlights. Small Towns and Villages
|


