Top 20 Long Index Ideas YTD From Best to Worst
| objective | YTD |
| POLAND | 49.85 |
| TURKEY | 42.62 |
| ARGENTINA | 37.02 |
| DENMARK | 34.46 |
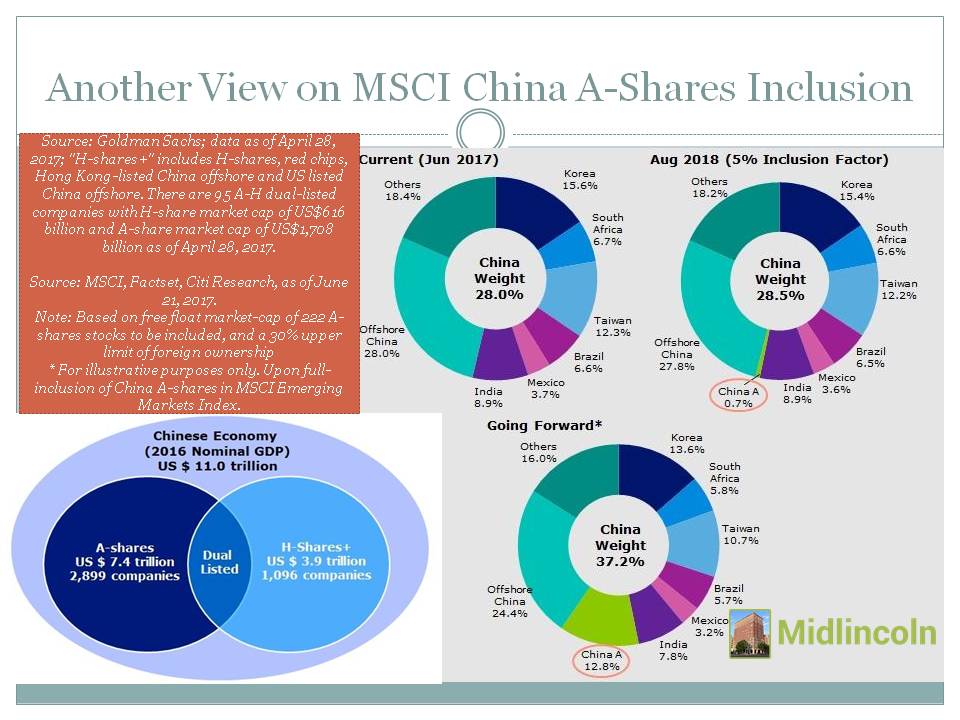
| CHINA | 31.10 |
| GREATER CHINA | 30.49 |
| EQUITY HEDGE DIVERSIFIED | 30.47 |
| CHILE | 30.42 |
| NETHERLANDS | 29.41 |
| FRANCE | 29.27 |
| INDIA | 28.42 |
| ITALY | 27.21 |
| GOVERNMENT ULTRA SHORT | 26.77 |
| TECHNOLOGY | 26.12 |
| BRIC | 26.04 |
| EMERGING MARKETS | 25.99 |
| KOREA | 25.24 |
| LATIN AMERICAN REGION | 25.18 |
| BELGIUM | 24.73 |
| TAIWAN | 24.68 |
Top 20 Short Index Ideas YTD From Best to Worst
| objective | YTD |
| ENERGY | -3.69 |
| AGRICULTURE | -3.37 |
| MANAGED FUTURES DISCRETIONARY | -2.95 |
| RUSSIA | 0.90 |
| ENERGY SECTOR | 2.27 |
| MORTGAGE-BACKED ARBITRAGE | 2.34 |
| SPECIALTY | 4.05 |
| AGGREGATE BOND EURO FOCUSED | 4.07 |
| VALUE MID CAP | 4.44 |
| DERIVATIVE | 4.51 |
| BROAD BASED | 4.54 |
| GCC | 4.65 |
| EURO FOCUSED (NON-US) | 4.89 |
| MUNI NATIONAL INTERMEDIATE | 5.04 |
| MUNI SINGLE STATE LONG | 5.20 |
| MUNI NATIONAL SHORT | 5.24 |
| MUNI CA INTERMEDIATE AND SHORT | 5.42 |
| VALUE SMALL CAP | 5.45 |
| AGGREGATE BOND YEN FOCUSED | 5.52 |
| MUNICIPALS | 5.84 |
Combined Performance of Tracked Indexes by Index Provider Top 20 Winners
| sourcename | ytd |
| Bolsa De Valores De Caracas (C | 1103.81 |
| Federal Reserve Bank of New Yo | 110.91 |
| US Treasury | 87.1 |
| SAUDI INVESTMENT BANK | 54.295 |
| NASDAQ OMX Riga | 53.21 |
| JASDAQ | 51.04 |
| AlphaShares | 50.379999999999995 |
| Ukrainian Stock Exchange | 46.75 |
| Istanbul Stock Exchange | 42.236666666666665 |
| Wiener Boerse | 42.08 |
| UK Office for National Statist | 41.555 |
| Palestine Exchange | 38.48 |
| Athens Stock Exchange | 38.47 |
| CEE Stock Exchange Group | 38.45 |
| Warsaw Stock Exchange | 38.43333333333333 |
| Central Bank of the UAE | 36.19 |
| Budapest Stock Exchange | 34.87 |
| Mercado De Valores Mendoza (Bu | 34.406666666666666 |
| BOVESPA | 33.586666666666666 |
| Intesa Sanpaolo | 33.494285714285716 |
Combined Performance of Tracked Indexes by Index Provider Top 20 Losers
| sourcename | ytd |
| Saudi Arabian Monetary Agency | -81.91 |
| CETIP | -40.28 |
| European Money Markets Institu | -35.28 |
| BofA Merrill Lynch | -29.91 |
| Qatar Exchange | -20.38 |
| Teucrium | -13.57 |
| Muscat Securities Market | -12.92 |
| Karachi Stock Exchange | -11.74 |
| Alerian Capital Management LLC | -7.029999999999999 |
| Cushing | -6.6499999999999995 |
| Bursa Malaysia Berhad | -5.94 |
| Royal Bank of Scotland | -5.48 |
| Goldman Sachs Commodity Index | -4.84 |
| Organization for Economic Coop | -4.67 |
| Beirut Stock Exchange | -4.25 |
| The Royal Bank of Scotland | -3.6345454545454534 |
| Mt. Lucas | -3.37 |
| Morningstar Inc. | -2.615 |
| Fundacao Getulio Vargas | -2.56 |
| Brazilian Mercantile & Futures | -2.39 |
Chart: Half of a BRIC is Back YTD?India +28% , China +31% and Brazil +23% Russia -2.3%  Source: ML Download file in Power PointRecent Index Atlas Ideas ChartArtIndex Rebalancing NewsMSCI Standard & Poor's Index FTSE Bloomberg Indices Dow Jones STOXX Index Futures TradingTop 20 Index Longs Based on Momentum
Top 20 Index Shorts Based on Momentum
Best Indexes last Week
Worst Indexes last Week
Best Indexes last Month
Worst Indexes last Month
Best Indexes YTD
Worst Indexes YTD
Best Indexes 1yr
Worst Indexes 1yr
Latest ML ComicsRecent ML Rural Highlights. Small Towns and Villages
|


