Emerging market stocks are up 21% ytd this year, Europe is up 14% and the US is up 8.5% while gold is up 9.6%.
In the usual mode emerging and developed markets and gold have been anti correlated asset classes: gold was rising when appetite for risk was low while markets where stronger when the risk appetite was stronger
In another mode of the markets gold and markets are both stronger when there is a lot of spare money chasing assets. In this mode emerging markets economies are usually doing well and jewelry in high demand in India and China, which is also good for the gold price.
While in the third mode of the markets the gold is stronger when there is game between US dollar and China yuan and especially when there is a tendency of China currency to be stronger vs. USD. Because in this case investment managers start reviewing all the possibilities global economic rebalancing and when China imports get cheaper with stronger domestic currency, Chinese start to buy more gold (actually oil as well) with more expensive yuan, and the demand drives the dollar price for gold.
At times gold is also stronger when the inflation is higher which is usually not too good for the markets because rates are higher and risk appetite is lower.
This year all the reasons for higher gold are working to push the gold price higher and gold bulls happy.
The risk is reining high that some sort of geo political one off (like an attack on North Korea) will shake the markets.
Emerging markets economies are doing well and India and China are buying some more gold especially in India ahead of new import taxes.
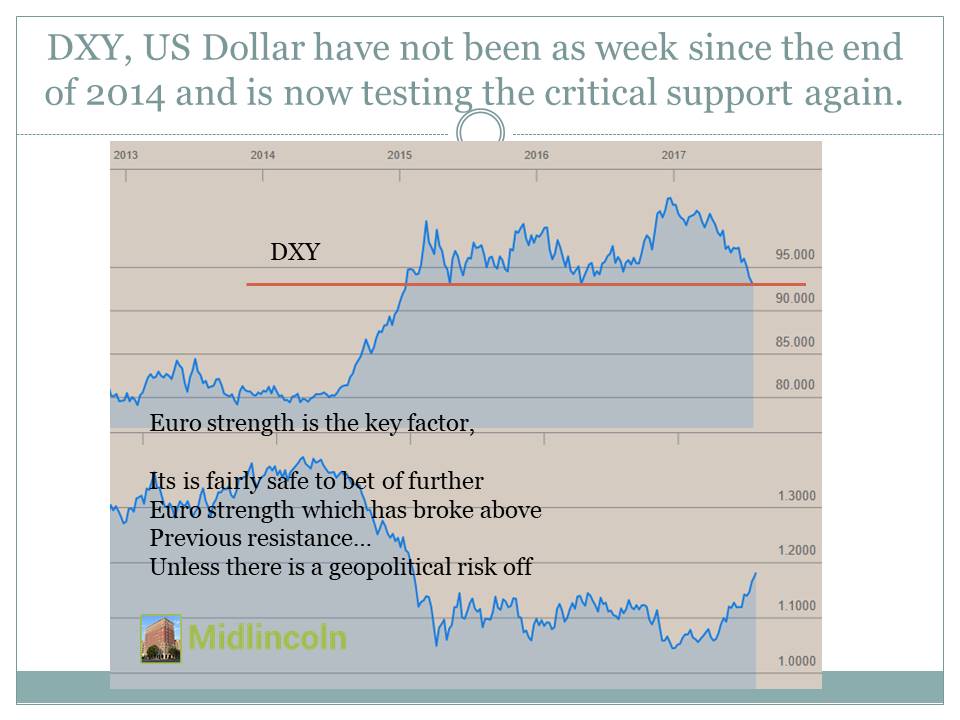
Dollar is weaker vs. many emerging and developed markets currencies and in particular it's quite weaker vs. yuan
Finally there is expectation of higher inflation in the US and higher rates as well as the economy grow further
One of the top markets this year is Ghana up 38%, and up 35% last month in July - like most of the gain was made just in one month.
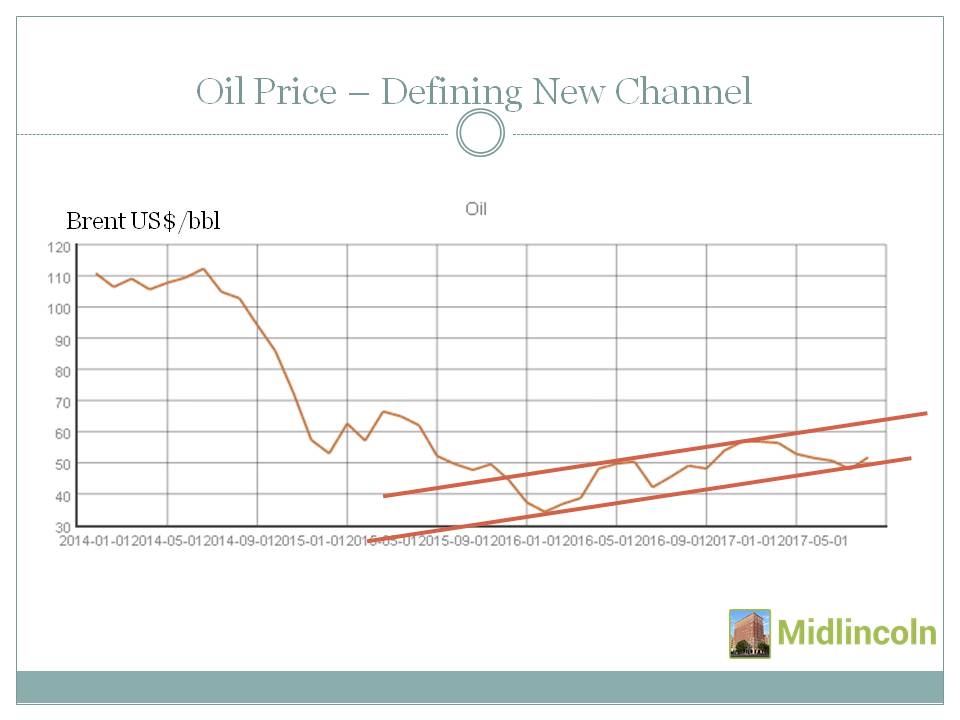
Like with oil which provides very strong factors for growth for oil exporting countries i.e. Russia, Brazil, Indonesia and etc.. when oil rises, there is also a connection between gold strength and country equities.
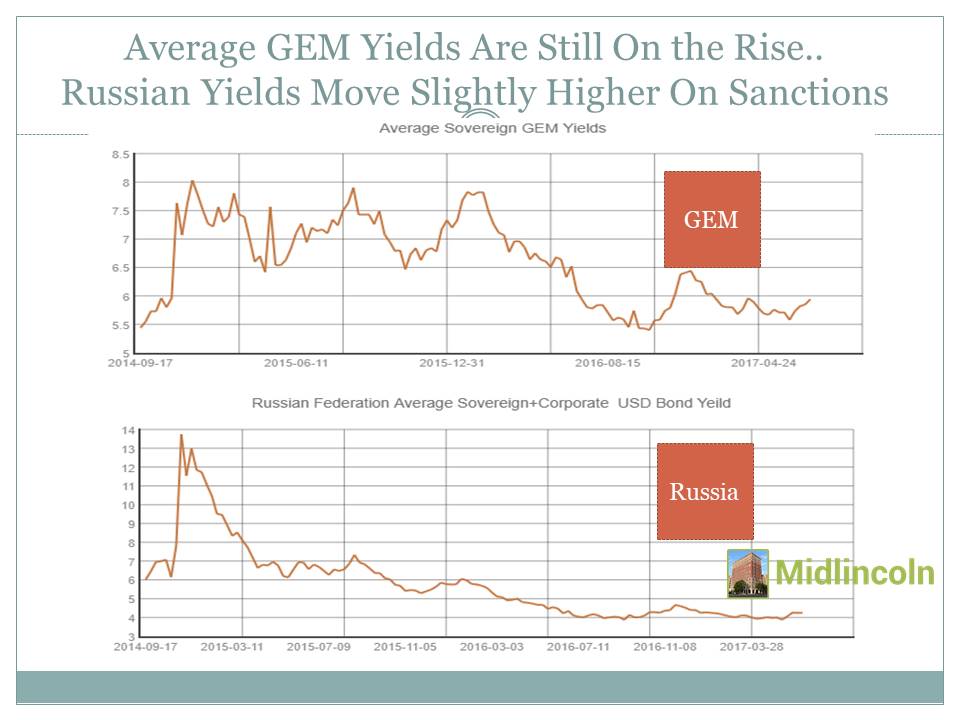
Global top gold producer China which produces 16bn$ worth of gold each year is up 30% this year. Australia which holds second place in terms of gold production with 10bn$ of gold is up 10% this year. Russia producing 9bn$ of gold per year in current prices is an outlier down 13%. The US with its 7.6bn$ of gold production is up 8.5% in terms of its equities. Canada with its 6.2$bn of gold in annual gold production is up 3%. Peru producing 5.4$bn is up 11% ytd. South Africa, producing 5.4$bn of gold pa is up 12% this year. Mexico with its 4.5$bn of gold is down 0.9%. Indonesia produces 3.6bn$ of gold and is up 11% ytd.
One of the strongest markets this year connected to gold is Ghana. It is producing 3.2$bn of gold and it is one of the most dynamically developing gold mining countries in the world and was once part of the Mali Kingdom where king Musa 1 has once the holder of all the global gold. Ghana is 38% ytd.
Another gold related country which is doing good this year (at least in terms of its economic growth GDP +5.2% or so) is Uzbekistan. Unfortunately Uzbek stocks are not available to foreign investors (which could change soon), but the country comes up 9th in terms of global gold production with 3.2bn$ of gold produced annually at current price.
The connection between equities and gold in most cases above is a pure coincidence. While the connection between gold and economic growth is not as strong for major gold producers as it is for oil producers. Gold would have played a bigger role for gold producing countries economies if the gold price would raise 10 fold and the cash margins for production of gold would match the cash margins for production of oil. In that case the gold would account for a very significant added value for the gold producers.
Can gold price rise 10 fold? Oil is mostly used to produce energy. Energy is becoming cheaper with the development of alternative energy sources, and oil is less used for energy production in some countries.
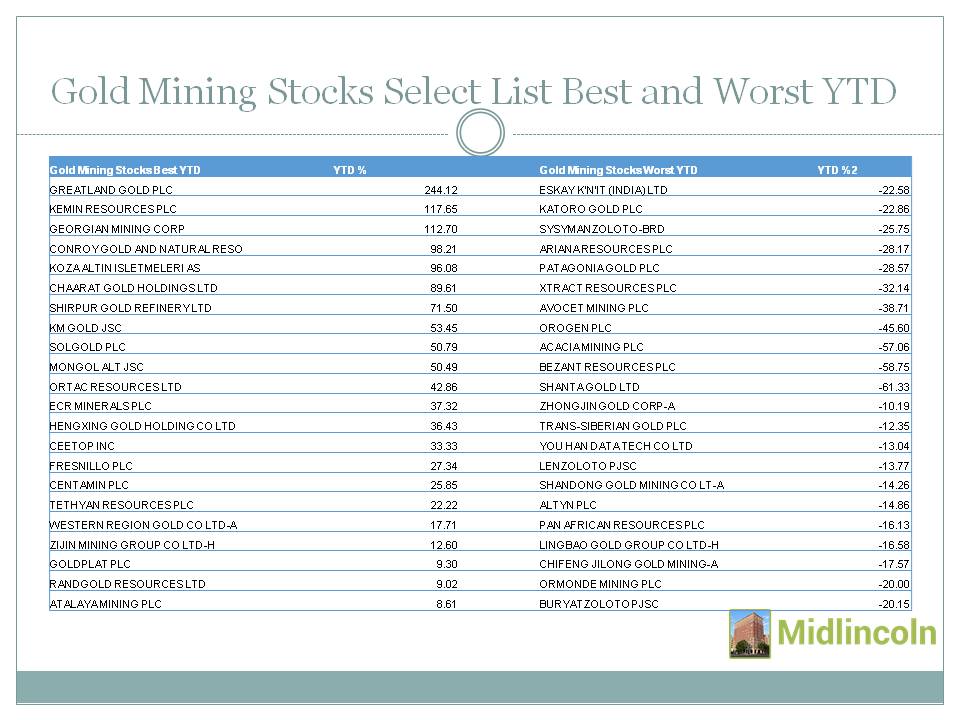
The drivers for gold demand are less researched than the drivers for energy demand. One hand there is risk, inflation; global net worth and dollar strength are among the factors for gold value. While on the other hand gold is mostly used for safety, power, sex and repentance that perhaps will be in more demand if energy becomes cheaper in another round of global economic rebalancing. In that case it is worth examining gold equities in more detail. Gold List
Best last month among various countries' equity markets were GHANA +35.21%, ESTONIA +19.58%, NORWAY +11.98%, BRAZIL +10.85%, NIGERIA +9.07%, CHILE +8.86%, TRINIDAD AND TOBAGO +8.74%, BELGIUM +8.50%, AUSTRIA +8.48%, CHINA +8.33%,
While worst last month among various countries' equity markets were ARGENTINA -6.92%, PAKISTAN -6.91%, SAUDI ARABIA DOMESTIC -5.64%, SRI LANKA -2.35%, ISRAEL -1.90%, BOTSWANA -1.89%, BANGLADESH -1.30%, JORDAN -1.29%, OMAN -0.96%, VIETNAM -0.30%,
Best YTD among various country equities were ZIMBABWE +58.61%, AUSTRIA +41.42%, POLAND +40.85%, NIGERIA +40.60%, JAMAICA +40.31%, BULGARIA +39.44%, GHANA +39.38%, TURKEY +36.82%, CHINA +33.97%, KAZAKHSTAN +33.62%,
While worst YTD among various country equities were OMAN -19.57%, RUSSIA -13.84%, PAKISTAN -12.84%, LEBANON -9.63%, QATAR -7.36%, BOTSWANA -4.93%, JORDAN -1.22%, SAUDI ARABIA DOMESTIC 0.27%, BANGLADESH 3.63%, TUNISIA 4.80%,


