Midlincoln Aggregates for funds
for week ending last Friday (inclusive)
| Focus | Objective | Asset Class | Flow USD mn |
| Commodities | INDUSTRIAL METALS | Commodity | 40.11 |
| Commodities | PRECIOUS METAL SECTOR | Equity | -3848.55 |
| Commodities | PRECIOUS METALS | Commodity | -1633.01 |
| Commodities | PRECIOUS METALS | Mixed Allocation | 12.05 |
| country | AUSTRALIA | Equity | 18.94 |
| country | AUSTRALIA | Fixed Income | -25.37 |
| country | AUSTRALIA | Mixed Allocation | -0.08 |
| country | BRAZIL | Equity | 73.19 |
| country | BRAZIL | Fixed Income | 131.67 |
| country | CHINA | Equity | -263.42 |
| country | CHINA | Fixed Income | -41.10 |
| Country | EGYPT | Equity | 3.48 |
| country | INDIA | Equity | -1607.19 |
| country | INDIA | Fixed Income | -22.77 |
| country | ISRAEL | Equity | 6.35 |
| country | JAPAN | Equity | 331.58 |
| country | JAPAN | Fixed Income | 58.73 |
| country | JAPAN | Mixed Allocation | 0.56 |
| country | KOREA | Equity | -183.96 |
| country | POLAND | Equity | 24.02 |
| country | RUSSIA | Equity | 405.02 |
| country | RUSSIA | Fixed Income | 27.03 |
| country | SOUTH AFRICA | Equity | 37.70 |
| country | SPAIN | Equity | -64.26 |
| Country | TAIWAN | Equity | 63.41 |
| country | TURKEY | Equity | 9.86 |
| country | UNITED KINGDOM | Equity | 296.58 |
| industry | BASIC MATERIALS SECTOR | Equity | 296.20 |
| industry | COMMUNICATIONS SECTOR | Equity | -388.72 |
| industry | ENERGY SECTOR | Equity | 821.47 |
| industry | FINANCIAL SECTOR | Equity | 1135.72 |
| industry | HEALTH CARE SECTOR | Equity | 3553.37 |
| industry | INDUSTRIAL SECTOR | Equity | 365.68 |
| industry | MULTIPLE SECTOR | Equity | 0.00 |
| industry | NATURAL RESOURCES SECTOR | Equity | 301.25 |
| industry | REAL ESTATE SECTOR | Alternative | 0.18 |
| industry | REAL ESTATE SECTOR | Equity | -2888.17 |
| industry | TECHNOLOGY SECTOR | Equity | 490.35 |
| industry | UTILITIES SECTOR | Equity | -1368.31 |
| region | AFRICAN REGION | Equity | -16.65 |
| region | AFRICAN REGION | Fixed Income | 3.01 |
| region | ASIAN PACIFIC REGION | Equity | -355.35 |
| region | ASIAN PACIFIC REGION | Fixed Income | -864.44 |
| region | ASIAN PACIFIC REGION EX JAPAN | Equity | -1507.56 |
| region | ASIAN PACIFIC REGION EX JAPAN | Fixed Income | -991.70 |
| region | ASIAN PACIFIC REGION EX JAPAN | Mixed Allocation | 79.80 |
| region | EASTERN EUROPEAN REGION | Equity | -18.49 |
| region | EASTERN EUROPEAN REGION | Fixed Income | 5.03 |
| region | EUROPEAN REGION | Equity | -2318.21 |
| region | EUROPEAN REGION | Fixed Income | -1369.08 |
| region | EUROPEAN REGION | Mixed Allocation | 19.58 |
| region | LATIN AMERICAN REGION | Equity | -865.10 |
| region | LATIN AMERICAN REGION | Fixed Income | -177.52 |
| region | MIDDLE EAST REGION | Equity | -14.55 |
| region | MIDDLE EAST REGION | Fixed Income | 0.21 |
| region | NORDIC REGION | Equity | 316.10 |
| region | NORTH AMERICAN REGION | Equity | 373.17 |
| region | NORTH AMERICAN REGION | Fixed Income | 4.99 |
| Risk | GOVERNMENT BOND | Alternative | 16.85 |
| Risk | GOVERNMENT BOND | Fixed Income | -953.72 |
| Risk | GOVERNMENT BOND | Mixed Allocation | -1.53 |
| Risk | INFLATION PROTECTED | Brazil | 10.81 |
| Risk | INFLATION PROTECTED | Fixed Income | -685.08 |
| Risk | INFLATION PROTECTED | Mixed Allocation | -22.43 |
| Risk | LONG SHORT | Alternative | -350.62 |
| Risk | LONG SHORT | Equity | 729.20 |
| Risk | LONG SHORT | Fixed Income | 9.87 |
| Risk | LONG SHORT | Mixed Allocation | 0.24 |
| Sector | AGRICULTURE | Commodity | 6.18 |
| Sector | AGRICULTURE | Equity | 0.01 |
| Sector | CONSUMER DISCRETIONARY | Equity | 154.30 |
| Sector | CONSUMER STAPLES | Equity | -1828.63 |
| segment | BRIC | Equity | -253.89 |
| segment | BRIC | Fixed Income | 68.35 |
| segment | DEVELOPED MARKETS | Equity | -1460.55 |
| segment | EMEA | Equity | -1.50 |
| segment | EMEA | Fixed Income | 1.16 |
| segment | EMERGING MARKETS | Equity | -481.38 |
| segment | EMERGING MARKETS | EquityA | 0.33 |
| segment | GCC | Equity | 0.92 |
| segment | GCC | Fixed Income | -0.89 |
| segment | GCC | Mixed Allocation | 5.43 |
| segment | MENA | Equity | -5.92 |
| segment | MENA | Fixed Income | -1.07 |
| Size | LARGE-CAP | Equity | 6201.55 |
| Size | MID-CAP | Commodity | -0.86 |
| Size | MID-CAP | Equity | 2395.84 |
| Size | SMALL-CAP | Equity | 4988.00 |
Source: Midlincoln Research
Fund Aggregates

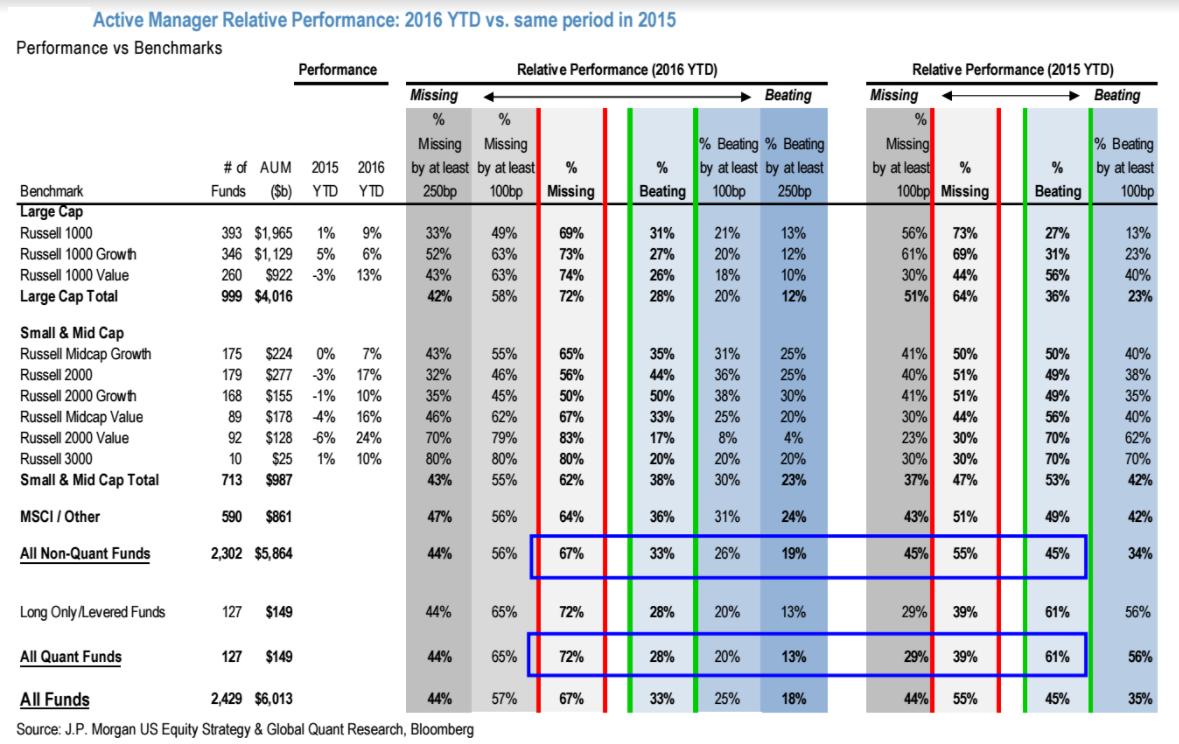
Chart: Distribution of Active Managers Beating Their Benchmark - within statistics. Just 1/3 of them are beating their benchmark.
Source: ML, BI
Emerging markets fund flow showed -481.4 USD mn of outflow.Emerging markets fund flow showed 0.3 USD mn of inflow. While Frontier Markets funds showed -5.0 USD mn of outflows.
BRAZIL Equity funds showed 73.2 USD mn of inflow.
BRAZIL Fixed Income funds showed 131.7 USD mn of inflow.
CHINA Equity funds showed -263.4 USD mn of outflow.
CHINA Fixed Income funds showed -41.1 USD mn of outflow.
INDIA Equity funds showed -1607.2 USD mn of outflow.
INDIA Fixed Income funds showed -22.8 USD mn of outflow.
KOREA Equity funds showed -184.0 USD mn of outflow.
RUSSIA Equity funds showed 405.0 USD mn of inflow.
RUSSIA Fixed Income funds showed 27.0 USD mn of inflow.
SOUTH AFRICA Equity funds showed 37.7 USD mn of inflow.
TURKEY Equity funds showed 9.9 USD mn of inflow.
COMMUNICATIONS SECTOR Equity funds showed -388.7 USD mn of outflow.
ENERGY SECTOR Equity funds showed 821.5 USD mn of inflow.
FINANCIAL SECTOR Equity funds showed 1135.7 USD mn of inflow.
REAL ESTATE SECTOR Alternative funds showed 0.2 USD mn of inflow.
REAL ESTATE SECTOR Equity funds showed -2888.2 USD mn of outflow.
TECHNOLOGY SECTOR Equity funds showed 490.3 USD mn of inflow.
UTILITIES SECTOR Equity funds showed -1368.3 USD mn of outflow.
LONG SHORT Alternative funds showed -350.6 USD mn of outflow.
LONG SHORT Equity funds showed 729.2 USD mn of inflow.
LONG SHORT Fixed Income funds showed 9.9 USD mn of inflow.
LONG SHORT Mixed Allocation funds showed 0.2 USD mn of inflow.
It is worth noting that MidLincoln data shows flow dynamics for last week ending last Friday where as EPFR data reports data only to last Wednesday, which makes ML data far more relevant
Top 5 fund winners and Top 5 losers by country by inflow
Russia Inflows
| assclass | profile | flow USD mln$ |
| Equity | Market Vectors Russia ETF is an exchange-traded | 99.99 |
| Equity | Swedbank Robur Rysslandsfonden is an open-end | 85.96 |
| Equity | JPMorgan Funds - Russia Fund is an open-end | 47.39 |
| Equity | East Capital - Russian Fund is an open-end | 31.30 |
| Equity | East Capital Lux - Russian Fund is an open-end | 31.17 |
Russia Outflows
| assclass | profile | flow USD mln$ |
| Equity | Direxion Daily Russia Bull 3x Shares is an | -29.80 |
| Equity | HSBC Global Investment Funds - Russia Equity | -26.89 |
| Equity | HSBC Global Investment Funds - Russia Equity | -14.25 |
| Equity | HSBC Global Investment Funds - Russia Equity | -13.77 |
| Equity | JPMorgan Funds - Russia Fund is an open-end | -11.51 |
Source: MidLincoln Research
China Inflows
| assclass | profile | flow USD mln$ |
| Equity | BlackRock Global Funds - China Fund is | 43.98 |
| Equity | BlackRock Global Funds - China Fund is | 43.79 |
| Equity | HSBC Global Investment Funds - Chinese | 43.43 |
| Equity | BlackRock Global Funds - China Fund is | 42.47 |
| Equity | LYXOR UCITS ETF CHINA ENTERPRISE HSCEI-C-USD | 31.81 |
China Outflows
| assclass | profile | flow USD mln$ |
| Equity | HSBC Global Investment Funds - Chinese | -99.99 |
| Equity | iShares Asia Trust - iShares FTSE A50 China | -99.99 |
| Equity | GAM Star plc - China Equity is a UCITS | -65.17 |
| Equity | HSBC Global Investment Funds - Chinese Equity | -40.02 |
| Equity | Hang Seng Investment Index Funds Series - | -32.43 |
Source: MidLincoln Research
South Africa Inflows
| assclass | profile | flow USD mln$ |
| Equity | iShares MSCI South Africa ETF is an exchange-traded | 44.12 |
| Equity | The Lyxor South Africa ETF is a UCITS compliant | 1.43 |
| Equity | The Lyxor South Africa ETF is a UCITS | 1.43 |
| Equity | HSBC MSCI South Africa UCITS ETF is an exchange-traded | 0.11 |
| Equity | NEXT FUNDS FTSE/JSE Africa Top40 Linked | -0.34 |
South Africa Outflows
| assclass | profile | flow USD mln$ |
| Equity | iShares MSCI South Africa UCITS ETF is an | -8.72 |
| Equity | NEXT FUNDS FTSE/JSE Africa Top40 Linked | -0.34 |
| Equity | NEXT FUNDS FTSE/JSE Africa Top40 Linked Exchange | -0.34 |
| Equity | HSBC MSCI South Africa UCITS ETF is an exchange-traded | 0.11 |
| Equity | The Lyxor South Africa ETF is a UCITS compliant | 1.43 |
Source: MidLincoln Research
Korea Inflows
| assclass | profile | flow USD mln$ |
| Equity | Matthews Korea Fund is an open-end fund | 15.29 |
| Equity | Lyxor ETF MSCI Korea is a UCITS compliant | 4.73 |
| Equity | JPMorgan Funds - Korea Equity is an open-end | 2.22 |
| Equity | JPMorgan Funds - Korea Equity is an open-end | 1.73 |
| Equity | Baring Korea Feeder Fund is an open-end | 1.05 |
Korea Outflows
| assclass | profile | flow USD mln$ |
| Equity | iShares MSCI South Korea Capped ETF is an | -91.27 |
| Equity | Deutsche X-trackers MSCI South Korea Hedged | -31.84 |
| Equity | db x-trackers - MSCI Korea TRN Index UCITS | -26.56 |
| Equity | db x-trackers - MSCI Korea TRN Index | -24.68 |
| Equity | JPMorgan Korea Fund is a unit trust incorporated | -17.50 |
Source: MidLincoln Research
India Inflows
| assclass | profile | flow USD mln$ |
| Equity | HSBC Global Investment Funds - Indian Equity | 34.15 |
| Equity | Vontobel India Fund is an open-end fund | 28.23 |
| Equity | WisdomTree India Earnings Fund is an exchange-traded | 13.41 |
| Equity | The Lyxor ETF MSCI India is a UCITS compliant | 5.45 |
| Equity | PowerShares India Portfolio is an exchange-traded | 4.62 |
India Outflows
| assclass | profile | flow USD mln$ |
| Equity | Aberdeen Global - India Equity Fund is a | -99.99 |
| Equity | Aberdeen Global - India Equity Fund is | -99.99 |
| Equity | Aberdeen Global - India Equity Fund is | -99.99 |
| Equity | Fidelity Funds - Indonesia Fund is a UCITS | -99.99 |
| Equity | Franklin Templeton Investment Funds - Franklin | -99.99 |
Source: MidLincoln Research
Turkey Inflows
| assclass | profile | flow USD mln$ |
| Equity | iShares MSCI Turkey ETF is an exchange-traded | 17.78 |
| Equity | iShares MSCI Turkey UCITS ETF is an open-end, | 1.09 |
| Equity | HSBC MSCI TURKEY UCITS ETF is an open-end, | 0.18 |
| Equity | 0.08 | |
| Equity | The Lyxor ETF Turkey (DJ Turkey Titans 20) | -9.26 |
Turkey Outflows
| assclass | profile | flow USD mln$ |
| Equity | The Lyxor ETF Turkey (DJ Turkey Titans 20) | -9.26 |
| Equity | 0.08 | |
| Equity | HSBC MSCI TURKEY UCITS ETF is an open-end, | 0.18 |
| Equity | iShares MSCI Turkey UCITS ETF is an open-end, | 1.09 |
| Equity | iShares MSCI Turkey ETF is an exchange-traded | 17.78 |
Source: MidLincoln Research
Brazil Inflows
| assclass | profile | flow USD mln$ |
| Fixed Income | Santander FIC FI Renda Fixa I Credito Privado | 99.99 |
| Equity | iShares MSCI Brazil Capped ETF is an exchange-traded | 87.64 |
| Equity | Direxion Daily Brazil Bull 3x Shares is an | 12.17 |
| Equity | Handelsbanken Funds - Brazil is an open-end | 9.92 |
| Equity | Fondo de Inversion iFund MSCI Brazil Small | 1.85 |
Brazil Outflows
| assclass | profile | flow USD mln$ |
| Equity | BNY Mellon Global Funds PLC - Brazil Equity | -23.03 |
| Fixed Income | HSBC Global Investment Funds - Brazil Bond | -5.93 |
| Equity | db x-trackers - MSCI Brazil TRN Index UCITS | -5.33 |
| Fixed Income | Aberdeen Global - Brazil Bond Fund is a | -5.03 |
| Fixed Income | Aberdeen Global - Brazil Bond Fund is a | -5.03 |
Source: MidLincoln Research
Australia Inflows
| assclass | profile | flow USD mln$ |
| Equity | iShares MSCI Australia ETF is an exchange-traded | 56.30 |
| Equity | Fidelity Funds - Australia Fund is an open-end | 9.90 |
| Equity | Fidelity Funds - Australia Fund is an open-end | 8.41 |
| Equity | Fidelity Funds - Australia Fund is an open-end | 8.10 |
| Equity | SmartOZZY is an investment fund incorporated | 2.54 |
Australia Outflows
| assclass | profile | flow USD mln$ |
| Equity | Swisscanto AST Avant Aktien Ausland Index | -30.20 |
| Fixed Income | -26.47 | |
| Equity | UBS (Lux) Equity Fund - Australia (AUD) | -14.98 |
| Equity | Australia Equity Income Fund is an open-end | -12.88 |
| Equity | UBS (Lux) Equity Fund - Australia (AUD) is | -9.89 |
Source: MidLincoln Research
Canada Inflows
Canada Outflows
Source: MidLincoln Research
Good luck! And don’t stay out of the market for too long. As the policy of being too cautious is the greatest risk of all.
Ovanes Oganisyan