Midlincoln Aggregates for funds
for week ending last Friday (inclusive)
| Focus | Objective | Asset Class | Flow USD mn |
| Commodities | INDUSTRIAL METALS | Commodity | -0.50 |
| Commodities | PRECIOUS METAL SECTOR | Equity | -35.41 |
| Commodities | PRECIOUS METALS | Commodity | -144.14 |
| country | AUSTRALIA | Fixed Income | -0.30 |
| country | BRAZIL | Equity | -39.36 |
| country | CHINA | Equity | -829.45 |
| country | INDIA | Equity | -32.58 |
| country | JAPAN | Equity | -75.47 |
| country | KOREA | Equity | -3.82 |
| country | RUSSIA | Equity | -6.98 |
| country | SOUTH AFRICA | Equity | -6.63 |
| industry | BASIC MATERIALS SECTOR | Equity | -0.02 |
| industry | COMMUNICATIONS SECTOR | Equity | -2.20 |
| industry | ENERGY SECTOR | Equity | -13.58 |
| industry | FINANCIAL SECTOR | Equity | -8.40 |
| industry | HEALTH CARE SECTOR | Equity | -222.60 |
| industry | NATURAL RESOURCES SECTOR | Equity | -8.91 |
| industry | REAL ESTATE SECTOR | Equity | -287.97 |
| industry | TECHNOLOGY SECTOR | Equity | -44.93 |
| industry | UTILITIES SECTOR | Equity | -10.48 |
| region | ASIAN PACIFIC REGION | Equity | -19.33 |
| region | ASIAN PACIFIC REGION EX JAPAN | Equity | -62.36 |
| region | EUROPEAN REGION | Equity | -73.45 |
| region | LATIN AMERICAN REGION | Equity | -28.65 |
| region | NORTH AMERICAN REGION | Equity | -14.83 |
| Risk | GOVERNMENT BOND | Fixed Income | -43.58 |
| Risk | LONG SHORT | Equity | -33.48 |
| Sector | AGRICULTURE | Commodity | -0.35 |
| Sector | CONSUMER DISCRETIONARY | Equity | -24.50 |
| Sector | CONSUMER STAPLES | Equity | -7.12 |
| segment | BRIC | Equity | -5.84 |
| segment | EMERGING MARKETS | Equity | -108.59 |
| Size | LARGE-CAP | Equity | -209.97 |
| Size | MID-CAP | Equity | -112.95 |
| Size | SMALL-CAP | Equity | -48.60 |
Source: Midlincoln Research
Fund Aggregates

Chart: Investors chose wrong side of the trade in Cons Disc, Inf.Tech and Health Care
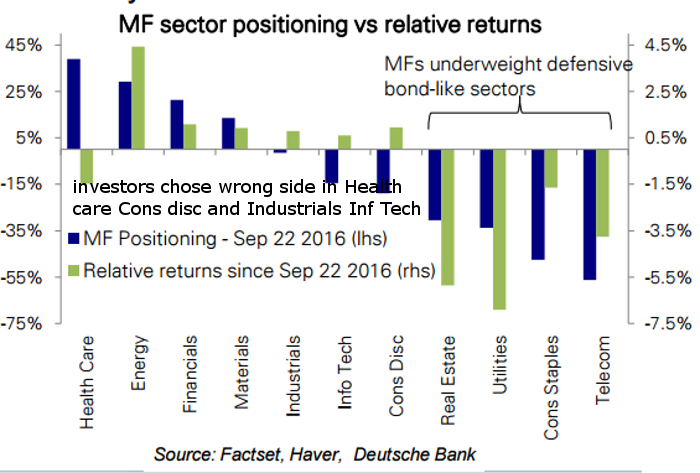
Source: Factset, DB, ValueWalk
Emerging markets fund flow showed -108.6 USD mn of outflow.. While Frontier Markets funds showed 0.0 USD mn of inflows.
BRAZIL Equity funds showed -39.4 USD mn of outflow.
CHINA Equity funds showed -829.5 USD mn of outflow.
INDIA Equity funds showed -32.6 USD mn of outflow.
KOREA Equity funds showed -3.8 USD mn of outflow.
RUSSIA Equity funds showed -7.0 USD mn of outflow.
SOUTH AFRICA Equity funds showed -6.6 USD mn of outflow.
COMMUNICATIONS SECTOR Equity funds showed -2.2 USD mn of outflow.
ENERGY SECTOR Equity funds showed -13.6 USD mn of outflow.
FINANCIAL SECTOR Equity funds showed -8.4 USD mn of outflow.
REAL ESTATE SECTOR Equity funds showed -288.0 USD mn of outflow.
TECHNOLOGY SECTOR Equity funds showed -44.9 USD mn of outflow.
UTILITIES SECTOR Equity funds showed -10.5 USD mn of outflow.
LONG SHORT Equity funds showed -33.5 USD mn of outflow.
It is worth noting that MidLincoln data shows flow dynamics for last week ending last Friday where as EPFR data reports data only to last Wednesday, which makes ML data far more relevant
Top 5 fund winners and Top 5 losers by country by inflow
Russia Inflows
| assclass | profile | flow USD mln$ |
| Equity | iShares MSCI Russia Capped ETF is an exchange-traded | 0.00 |
| Equity | East Capital - Russian Fund is an open-end | 0.00 |
| Equity | Source RDX UCITS ETF is a UCITS compliant | -0.02 |
| Equity | HSBC MSCI Russia Capped UCITS ETF $ is a | -0.05 |
| Equity | HSBC MSCI Russia Capped UCITS ETF $ is a | -0.05 |
Russia Outflows
| assclass | profile | flow USD mln$ |
| Equity | Market Vectors Russia ETF is an exchange-traded | -1.75 |
| Equity | East Capital Lux - Russian Fund is an open-end | -0.57 |
| Equity | Swedbank Robur Rysslandsfonden is an open-end | -0.53 |
| Equity | JPMorgan Funds - Russia Fund is an open-end | -0.51 |
| Equity | JPMorgan Funds - Russia Fund is an open-end | -0.51 |
Source: MidLincoln Research
China Inflows
| assclass | profile | flow USD mln$ |
| Equity | LYXOR UCITS ETF CHINA ENTERPRISE HSCEI-C-USD | 0.00 |
| Equity | GAM Star plc - China Equity is a UCITS certified | 0.00 |
| Equity | W.I.S.E. - CSI 300 China Tracker® is an index-tracking | -0.44 |
| Equity | Deutsche X-trackers Harvest CSI 300 China | -0.47 |
| Equity | LYXOR UCITS ETF CHINA ENTERPRISE HSCEI - | -0.55 |
China Outflows
| assclass | profile | flow USD mln$ |
| Equity | HSBC Global Investment Funds - Chinese | -99.99 |
| Equity | Hang Seng Investment Index Funds Series - | -6.16 |
| Equity | iShares China Large-Cap ETF is an exchange-traded | -3.97 |
| Equity | First State Global Umbrella PLC - China | -3.87 |
| Equity | CSOP FTSE China A50 ETF is an exchange-traded | -3.07 |
Source: MidLincoln Research
South Africa Inflows
| assclass | profile | flow USD mln$ |
| Equity | iShares MSCI South Africa ETF is an exchange-traded | 0.00 |
| Equity | The Lyxor South Africa ETF is a UCITS compliant | 0.00 |
| Equity | The Lyxor South Africa ETF is a UCITS | 0.00 |
| Equity | The RBS Market Access FTSE/JSE Africa Top40 | -0.01 |
| Equity | NEXT FUNDS FTSE/JSE Africa Top40 Linked Exchange | -0.01 |
South Africa Outflows
| assclass | profile | flow USD mln$ |
| Equity | NEXT FUNDS FTSE/JSE Africa Top40 Linked | -6.33 |
| Equity | HSBC MSCI South Africa UCITS ETF is an exchange-traded | -0.26 |
| Equity | iShares MSCI South Africa UCITS ETF is an | -0.03 |
| Equity | The RBS Market Access FTSE/JSE Africa Top40 | -0.01 |
| Equity | NEXT FUNDS FTSE/JSE Africa Top40 Linked Exchange | -0.01 |
Source: MidLincoln Research
Korea Inflows
| assclass | profile | flow USD mln$ |
| Equity | Deutsche X-trackers MSCI South Korea Hedged | 0.00 |
| Equity | iShares MSCI Korea UCITS ETF (Acc) is an | 0.00 |
| Equity | 0.00 | |
| Equity | db x-trackers - MSCI Korea TRN Index | 0.00 |
| Equity | DJ SOUTH KOREA TITANS 30 THEAM EASY UCITS | -0.01 |
Korea Outflows
| assclass | profile | flow USD mln$ |
| Equity | iShares MSCI South Korea Capped ETF is an | -3.52 |
| Equity | db x-trackers - MSCI Korea TRN Index UCITS | -0.18 |
| Equity | Lyxor ETF MSCI Korea is a UCITS compliant | -0.05 |
| Equity | Value Korea ETF is an exchange-traded fund | -0.04 |
| Equity | WisdomTree Korea Hedged Equity Fund is an | -0.02 |
Source: MidLincoln Research
India Inflows
| assclass | profile | flow USD mln$ |
| Equity | iShares Asia Trust - iShares S&P BSE SENSEX | 0.00 |
| Equity | PowerShares India Portfolio is an exchange-traded | 0.00 |
| Equity | 0.00 | |
| Equity | Franklin Templeton Investment Funds - Franklin | 0.00 |
| Equity | GS India Equity Portfolio is a Portfolio | 0.00 |
India Outflows
| assclass | profile | flow USD mln$ |
| Equity | Aberdeen Global - India Equity Fund is a | -5.15 |
| Equity | Aberdeen Global - India Equity Fund is | -4.92 |
| Equity | iShares MSCI India ETF is an exchange-traded | -4.13 |
| Equity | Aberdeen Global - India Equity Fund is | -3.34 |
| Equity | Franklin Templeton Investment Funds - Franklin | -3.07 |
Source: MidLincoln Research
Turkey Inflows
Turkey Outflows
Source: MidLincoln Research
Brazil Inflows
| assclass | profile | flow USD mln$ |
| Equity | iShares MSCI Brazil Capped ETF is an exchange-traded | 0.00 |
| Equity | Lyxor ETF Brazil (IBOVESPA) EUR is an exchange | 0.00 |
| Equity | Fondo Mutuo BRZ Brazilian Equities is an | 0.00 |
| Equity | HSBC Global Investment Funds - Brazil Equity | 0.00 |
| Equity | HSBC Global Investment Funds - Brazil Equity | 0.00 |
Brazil Outflows
| assclass | profile | flow USD mln$ |
| Equity | NEXT FUNDS Ibovespa Linked Exchange Traded | -38.02 |
| Equity | Lyxor ETF Brazil (Ibovespa) USD is an exchange | -0.26 |
| Equity | JPMorgan Funds - Brazil Equity is an open-end | -0.23 |
| Equity | JPMorgan Funds - Brazil Equity is an open-end | -0.23 |
| Equity | iShares MSCI Brazil UCITS ETF (Dist) is an | -0.22 |
Source: MidLincoln Research
Australia Inflows
| assclass | profile | flow USD mln$ |
| Fixed Income | 0.00 | |
| Fixed Income | ZKB-CIF I Australia Govt. Bond Index is | -0.02 |
| Fixed Income | Daiwa Bond Fund Series - Monthly Dividend | -0.04 |
| Fixed Income | UBS Australian Bond Income Fund is an open-end | -0.24 |
Australia Outflows
| assclass | profile | flow USD mln$ |
| Fixed Income | UBS Australian Bond Income Fund is an open-end | -0.24 |
| Fixed Income | Daiwa Bond Fund Series - Monthly Dividend | -0.04 |
| Fixed Income | ZKB-CIF I Australia Govt. Bond Index is | -0.02 |
| Fixed Income | 0.00 |
Source: MidLincoln Research
Canada Inflows
Canada Outflows
Source: MidLincoln Research
Good luck! And don’t stay out of the market for too long. As the policy of being too cautious is the greatest risk of all.
Ovanes Oganisyan