ML Agribusiness
By: Research Team

Description
Covering Global Agribusiness
Comment
Best last week among stocks was CF Industries Holdings Inc (CF:US) +16.34%, China Agri-Industries Holdings Ltd (606:HK) +11.79%, Sociedad Quimica y Minera de Chile SA (SQM/B:CI) +8.23%,
While worst last week among stocks was Incitec Pivot Ltd (IPL:AU) -3.52%, Charoen Pokphand Indonesia Tbk PT (CPIN:IJ) -3.31%, Astra Agro Lestari Tbk PT (AALI:IJ) -3.22%,
Best last month among stocks was Sociedad Quimica y Minera de Chile SA (SQM/B:CI) +58.37%, Charoen Pokphand Indonesia Tbk PT (CPIN:IJ) +45.79%, Felda Global Ventures Holdings Bhd (FGV:MK) +40.10%,
While worst last month among stocks was Associated British Foods PLC (ABF:LN) -12.45%, Astra Agro Lestari Tbk PT (AALI:IJ) -8.15%, Tyson Foods Inc (TSN:US) -6.73%,
Best YTD among stocks was Sociedad Quimica y Minera de Chile SA (SQM/B:CI) +58.37%, Charoen Pokphand Indonesia Tbk PT (CPIN:IJ) +45.79%, Felda Global Ventures Holdings Bhd (FGV:MK) +40.10%,
While worst YTD among stocks was Associated British Foods PLC (ABF:LN) -37.14%, CF Industries Holdings Inc (CF:US) -34.26%, Incitec Pivot Ltd (IPL:AU) -24.47%,
Chart: Government Grain Interventions are Inflationary

Source: Liveming, RBI
Chart: Cattle futures at 6 year low catalyzing m&a in the sector
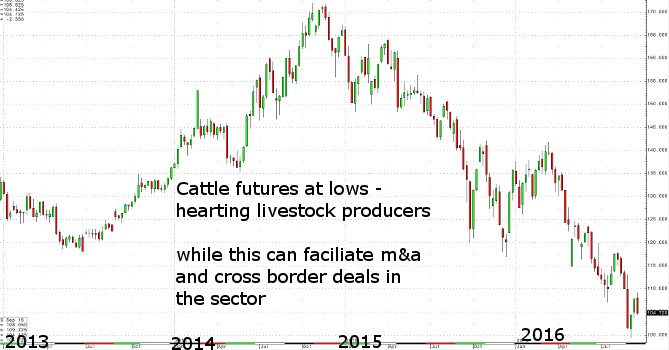
Source: ML
Chart: Most Profitable Weightings For AgriBusiness Basket - Momentum, Profitability and Risk
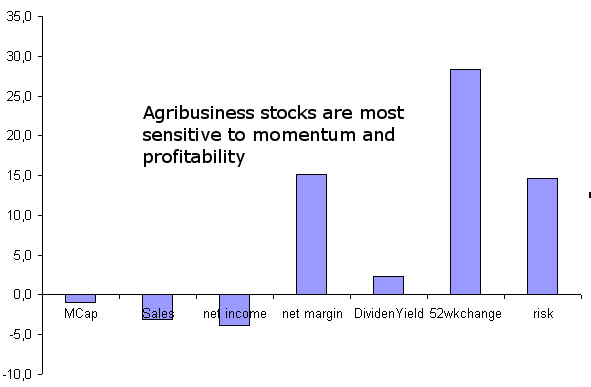
Source: ML
Chart: Kondratieff original stydy focuse on agri and other commodities
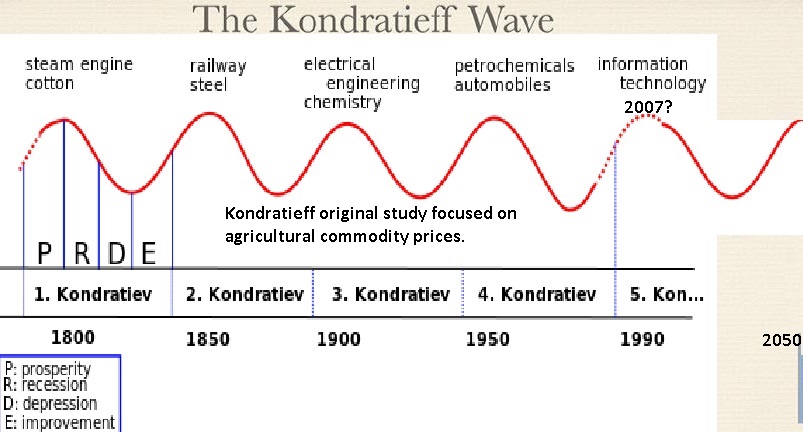
Source:
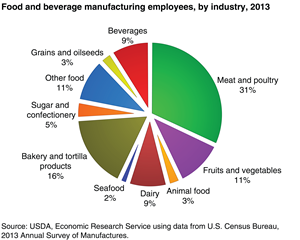
Chart: In 2013, the U.S. food and beverage manufacturing sector employed about 1.5 million people, or just over 1 percent of all U.S.
Source: USDA
Chart: In 2014, 17.3 million full- and part-time jobs were related to agriculture—about 9.3 percent of total U.S. employment.
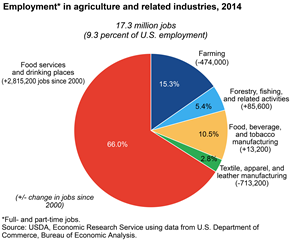
Source: USDA
Chart: Households spend 12.6-percent on food ranked third behind housing (33.3 percent) and transportation (17%)
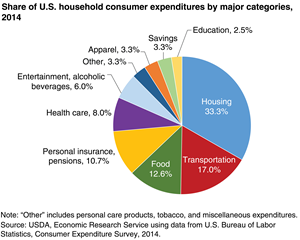
Source: USDA
Chart: Agriculture and agriculture-related industries contributed $835 billion to the U.S. gross domestic product (GDP) in 2014
a 4.8-percent share
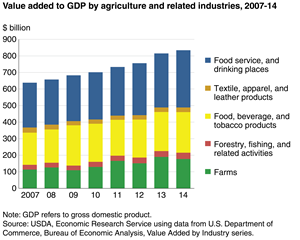
Source: USDA
Chart: More Crops are Used for Animal Feeds
Source: WorldBank
Chart: Ferts Consumption Made a Big Jump

Source: WorldBank
Chart: Despite That Land under Cereals Has been Flat for A while
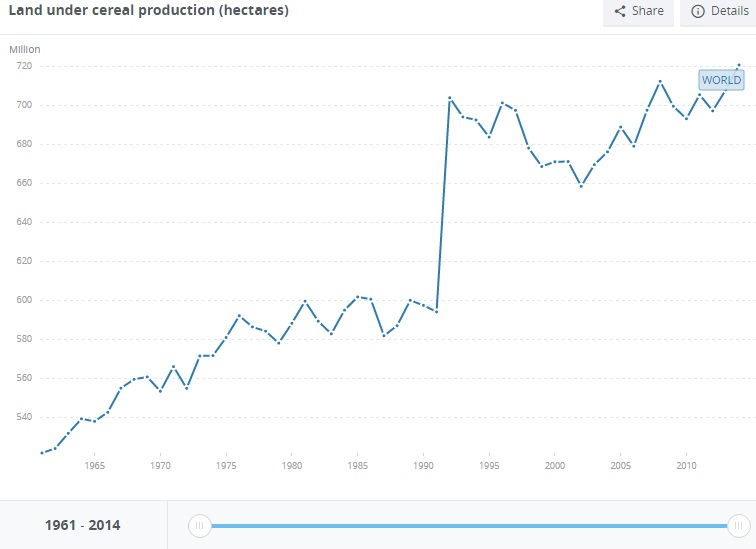
Source: WorldBank
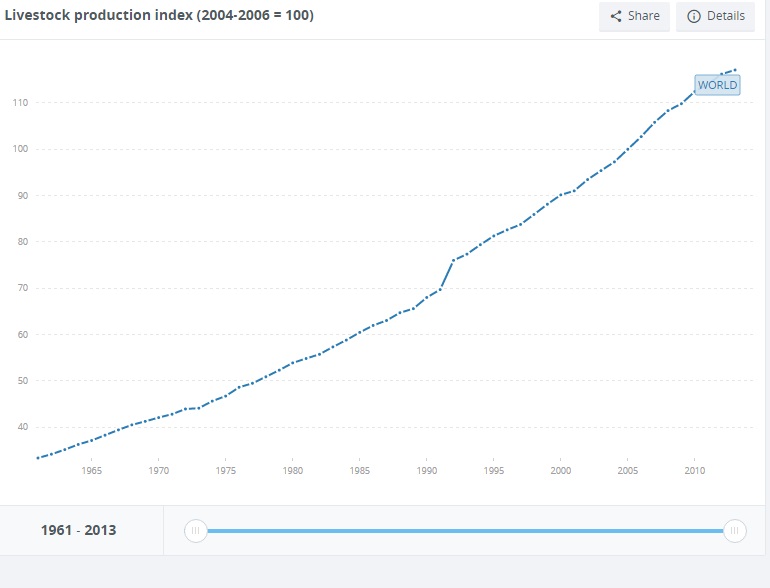
Chart: To Produce More Food
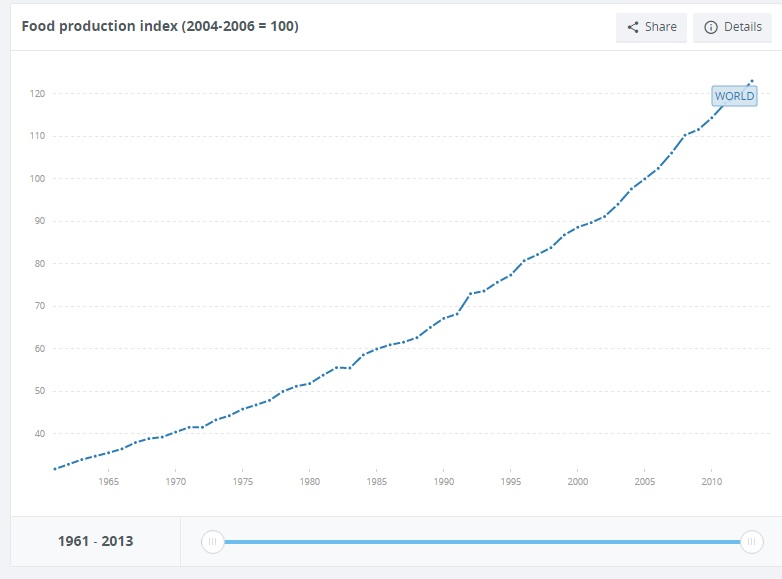
Source: WorldBank
Chart: And Crops are Rising
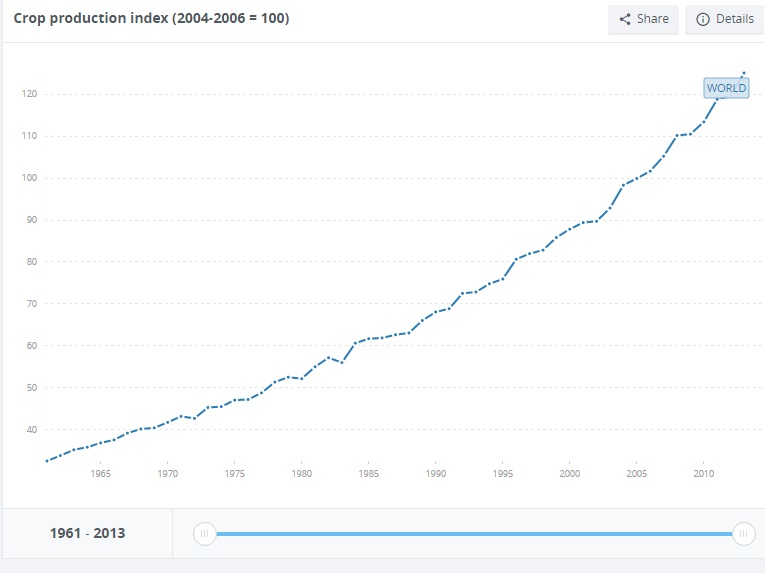
Source: WorldBank
Agriculture Finance
Agriculture Finance Corporation rules out waiver of interest on ...The Agriculture Finance Corporation waives interest on farmers' loansFarm Notes: Financial aid, loans, soybeansGhana: Girsal to Boost Agriculture for Economic Growth and ...Guidelines on Islamic financing for agriculture
Agricultural Land Prices
Structural changes in Germany as a result of climbing agricultural ...Farm prices have gone hog wildUS farmland prices fall for first time in six yearsFarmland being fed with sandBrazilian farmland is getting more expensive
Agricultural Commodities
What's Behind the Glut in Agricultural CommoditiesChicago agricultural commodities rally over past weekSuicide car bomb rocks Somali capital - policeVenezuela congress presses for Maduro trial, escalating standoffIraq's parliament votes to ban alcoholic beverages
Fertilizers
OCP and Kribhco to Develop a Large Scale NPK Fertilizer Plant in ...Fertilizers Were More Affordable Last WeekMining Group Guarantees Zeolite for Fertilizers in CubaAbraaj buys stake in Indorama FertilizersFertilizers Come Back to Earth
Productivity in Agriculture
Tonkolili takes the lead on agriculture productivityGAP Report: Agricultural Productivity Growth StallsModernising agriculture sector: Raising productivityLack of R&D funding threatens agricultural productivity: Australian ...Agric Technology will increase productivity, World BankCountry Composition
| Country | Weight % |
| United States | 30.00 |
| Malaysia | 13.33 |
| Ukraine | 6.67 |
| Indonesia | 6.67 |
| United Kingdom | 6.67 |
| Canada | 6.67 |
| Russian Federation | 6.67 |
| Australia | 3.33 |
| China | 3.33 |
| Norway | 3.33 |
| Taiwan | 3.33 |
| Hong Kong (SAR) | 3.33 |
| Switzerland | 3.33 |
| Chile | 3.33 |
Loading graph...
/Sector Composition
| Country | Weight % |
| United States | 30.00 |
| Malaysia | 13.33 |
| Ukraine | 6.67 |
| Indonesia | 6.67 |
| United Kingdom | 6.67 |
| Canada | 6.67 |
| Russian Federation | 6.67 |
| Australia | 3.33 |
| China | 3.33 |
| Norway | 3.33 |
| Taiwan | 3.33 |
| Hong Kong (SAR) | 3.33 |
| Switzerland | 3.33 |
| Chile | 3.33 |
Loading graph...
Key Basket Multiples
| Stocks | Total MCap US mn | Payout Ratio | Div Yield | PE | NetMargin | 1yr Return |
| 30 | 317666.5 | 44.0 | 2.4 | 20.49 | 10.01 | 8.6 |
| value | MCap US mn | DividendYield | PE | PS | NetMarginPct | PayoutRatio | 52wkchange | Score |
| Incitec Pivot Ltd | 3643.93 | 5.36% | 16.74 | 1.33 | 7.95 | 89.73 | -27.68 | 46.75 |
| Potash Corp of Saskatchewan Inc | 13873.79 | 2.43% | 17.80 | 2.67 | 15.00 | 43.25 | -19.00 | 14.95 |
| Agrium Inc | 12647.19 | 3.81% | 14.13 | 0.90 | 6.37 | 53.84 | -0.51 | 39.07 |
| Sociedad Quimica y Minera de Chile SA | 7989.80 | 0.59% | 38.51 | 4.43 | 11.50 | 22.72 | 59.41 | 48.62 |
| China BlueChemical Ltd | 956.64 | 5.87% | 34.70 | 0.66 | 1.90 | 203.69 | -25.89 | 138.50 |
| China Agri-Industries Holdings Ltd | 2117.96 | - | - | 0.20 | 0.00 | 0.00 | 6.09 | -0.41 |
| Astra Agro Lestari Tbk PT | 2153.26 | 0.68% | 24.91 | 1.98 | 7.95 | 16.94 | -26.82 | -33.34 |
| Charoen Pokphand Indonesia Tbk PT | 4498.47 | 0.81% | 22.67 | 1.73 | 7.63 | 18.36 | 45.78 | 42.60 |
| Genting Plantations Bhd | 2000.48 | 0.47% | 49.88 | 6.26 | 12.55 | 23.44 | -0.84 | -21.23 |
| PPB Group Bhd | 4544.22 | 1.55% | 23.73 | 4.47 | 18.84 | 36.78 | 2.78 | 28.17 |
| IOI Corp Bhd | 6760.43 | 1.77% | 44.95 | 2.42 | 5.38 | 79.56 | 5.82 | 39.31 |
| Felda Global Ventures Holdings Bhd | 2000.24 | 1.74% | - | 0.50 | 0.00 | -0.00 | 31.43 | 24.93 |
| Yara International ASA | 9473.15 | 5.27% | 10.94 | 0.79 | 7.22 | 57.65 | -21.56 | 25.88 |
| Uralkali PJSC | 7784.59 | - | 6.04 | 1.71 | 28.31 | -0.00 | 6.12 | 21.89 |
| Ros Agro PLC | 1824.00 | 3.45% | 4.18 | 1.31 | 31.34 | 14.42 | 51.13 | 86.21 |
| Syngenta AG | 39264.32 | 2.61% | 33.00 | 3.03 | 9.18 | 86.13 | 29.18 | 84.99 |
| Taiwan Fertilizer Co Ltd | 1318.68 | 4.92% | 16.22 | 2.68 | 16.52 | 79.80 | 4.66 | 78.27 |
| MHP SA | 987.99 | 8.05% | 40.03 | 0.85 | 2.12 | 322.24 | 7.80 | 285.63 |
| Kernel Holding SA | 1142.48 | 1.68% | - | - | 0.00 | -0.00 | 13.59 | 7.09 |
| Associated British Foods PLC | 24429.22 | 1.40% | 26.68 | 1.57 | 5.88 | 37.35 | -20.12 | -10.07 |
| CNH Industrial NV | 10431.70 | 1.85% | - | - | 0.00 | -0.00 | 14.53 | 8.03 |
| CF Industries Holdings Inc | 6043.00 | 4.63% | 16.60 | 1.45 | 8.73 | 76.86 | -50.12 | 12.37 |
| Mosaic Co/The | 8513.00 | 4.52% | 15.84 | 1.12 | 7.07 | 71.60 | -29.03 | 27.29 |
| Bunge Ltd | 8485.00 | 2.76% | 12.04 | 0.21 | 1.74 | 33.23 | -21.38 | -4.95 |
| Archer-Daniels-Midland Co | 24620.00 | 2.84% | 15.60 | 0.40 | 2.56 | 44.30 | -6.86 | 17.91 |
| Deere & Co | 27176.00 | 2.78% | 17.24 | 1.02 | 5.92 | 47.93 | 10.92 | 41.02 |
| AGCO Corp | 4162.00 | 1.01% | 19.12 | 0.59 | 3.09 | 19.31 | 11.94 | 8.71 |
| Monsanto Co | 44705.00 | 2.12% | 22.49 | 3.33 | 14.81 | 47.68 | 14.26 | 47.75 |
| FMC Corp | 6349.00 | 1.39% | 20.51 | 1.90 | 9.26 | 28.51 | 28.48 | 39.24 |
| Tyson Foods Inc | 27771.00 | 0.86% | 4.35 | 0.71 | 16.32 | 3.74 | 47.99 | 57.20 |
Index Sector Valuations vs GEM Average
| Sector | Sector MCap US mn | Sector MCap Share in Total | Gem Sector Share In Total GEM | GEM Sector MCAP USmn | Payout Ratio | GEM Payout Ratio | Div Yield | GEM Div Yield | PE | PEGEM | PE Discount vs GEM | NetMargin | NetMarginGEM | Margin Diff. vs GEM | 1yr Return | GEM 1yr Return |
| Consumer Staples | 113334.7 | 35.7 | 7.5 | 584775.3 | 29.3 | 38.0 | 1.8 | 1.8 | 18.3 | 28.2 | -35.1 | 8.6 | 10.3 | 1.7 | 7.8 | 12.3 |
| Industrials | 41769.7 | 13.1 | 5.8 | 453138.2 | 33.1 | 23.4 | 2.4 | 1.8 | 17.5 | 18.6 | -5.9 | 5.5 | 11.4 | 5.9 | 11.9 | 22.9 |
| Materials | 162562.1 | 51.2 | 7.6 | 590209.4 | 57.0 | 27.5 | 2.8 | 3.1 | 22.6 | 18.1 | 24.9 | 11.8 | 9.8 | -2.0 | 8.3 | -0.1 |
Top 5 ML Agribusiness Long Picks
| baskettable | value | stock | Country | Industry | MCapUSDmn | DividendYield | PE | PS | NetMarginPct | PayoutRatio | 52wkchange | Score |
| ml_basketpriceagri | MHP SA | MHPC:LI | Ukraine | Agricultural Producers | 987.99 | 8.05% | 40.03 | 0.85 | 2.12 | 322.24 | 7.80 | 285.63 |
| ml_basketpriceagri | China BlueChemical Ltd | 3983:HK | China | Agricultural Chemicals | 956.64 | 5.87% | 34.70 | 0.66 | 1.90 | 203.69 | -25.89 | 138.50 |
| ml_basketpriceagri | Ros Agro PLC | AGRO:LI | Russian Federation | Agricultural Products Whslrs | 1824.00 | 3.45% | 4.18 | 1.31 | 31.34 | 14.42 | 51.13 | 86.21 |
| ml_basketpriceagri | Syngenta AG | SYNN:VX | Switzerland | Agricultural Chemicals | 39264.32 | 2.61% | 33.00 | 3.03 | 9.18 | 86.13 | 29.18 | 84.99 |
| ml_basketpriceagri | Taiwan Fertilizer Co Ltd | 1722:TT | Taiwan | Agricultural Chemicals | 1318.68 | 4.92% | 16.22 | 2.68 | 16.52 | 79.80 | 4.66 | 78.27 |
Top 5 ML Agribusiness Short Picks
| baskettable | value | stock | Country | Industry | MCapUSDmn | DividendYield | PE | PS | NetMarginPct | PayoutRatio | 52wkchange | Score |
| ml_basketpriceagri | China Agri-Industries Holdings Ltd | 606:HK | Hong Kong (SAR) | Agricultural Producers | 2117.96 | - | - | 0.20 | 0.00 | 0.00 | 6.09 | -0.41 |
| ml_basketpriceagri | Bunge Ltd | BG:US | United States | Agricultural Products Whslrs | 8485.00 | 2.76% | 12.04 | 0.21 | 1.74 | 33.23 | -21.38 | -4.95 |
| ml_basketpriceagri | Associated British Foods PLC | ABF:LN | United Kingdom | Packaged Food | 24429.22 | 1.40% | 26.68 | 1.57 | 5.88 | 37.35 | -20.12 | -10.07 |
| ml_basketpriceagri | Genting Plantations Bhd | GENP:MK | Malaysia | Agricultural Producers | 2000.48 | 0.47% | 49.88 | 6.26 | 12.55 | 23.44 | -0.84 | -21.23 |
| ml_basketpriceagri | Astra Agro Lestari Tbk PT | AALI:IJ | Indonesia | Agricultural Producers | 2153.26 | 0.68% | 24.91 | 1.98 | 7.95 | 16.94 | -26.82 | -33.34 |
xxxxxxxxxxxxxxxxxxxxxxxxxxxxxxxxxxx
xxxxxxxxxxxxxxxxxxxxxxxxxxxxxxxxxxx
Weekly Fund flow into Agri focused funds showed (Previous Week)3.2 USD mn of inflow
Top 10 Agri Focused Funds by Inflows Last Week
| Fund Name | fund flow mn$ | Total Assets mn$ | | POWERSHARES GLOBAL AGRICULTURE (PSUU) | 0.0 | 5.6 | | ETFS AGRICULTURE DJ-UBSCI (AIGA) | -7.5 | 243.0 |
Top 10 Agri Focused Funds by Outflow Last Week
| Fund Name | fund flow mn$ | Total Assets mn$ | | ETFS AGRICULTURE DJ-UBSCI (AIGA) | -7.5 | 243.0 | | POWERSHARES GLOBAL AGRICULTURE (PSUU) | 0.0 | 5.6 |
|
|