ML Agribusiness
By: Research Team

Description
Covering Global Agribusiness
Comment
Best last week among stocks was Ros Agro PLC (AGRO:LI) +3.04%, AGCO Corp (AGCO:US) +2.44%, MHP SA (MHPC:LI) +2.31%,
While worst last week among stocks was Associated British Foods PLC (ABF:LN) -8.16%, Uralkali PJSC (URKA:RM) -7.49%, CF Industries Holdings Inc (CF:US) -6.57%,
Best last month among stocks was AGCO Corp (AGCO:US) +8.00%, Incitec Pivot Ltd (IPL:AU) +7.88%, Deere & Co (DE:US) +4.67%,
While worst last month among stocks was Associated British Foods PLC (ABF:LN) -21.12%, Mosaic Co/The (MOS:US) -14.72%, CF Industries Holdings Inc (CF:US) -9.68%,
Best YTD among stocks was Charoen Pokphand Indonesia Tbk PT (CPIN:IJ) +50.73%, Sociedad Quimica y Minera de Chile SA (SQM/B:CI) +45.88%, Felda Global Ventures Holdings Bhd (FGV:MK) +41.40%,
While worst YTD among stocks was CF Industries Holdings Inc (CF:US) -41.56%, Associated British Foods PLC (ABF:LN) -39.66%, Incitec Pivot Ltd (IPL:AU) -23.55%,
Chart: Cattle futures at 6 year low catalyzing m&a in the sector
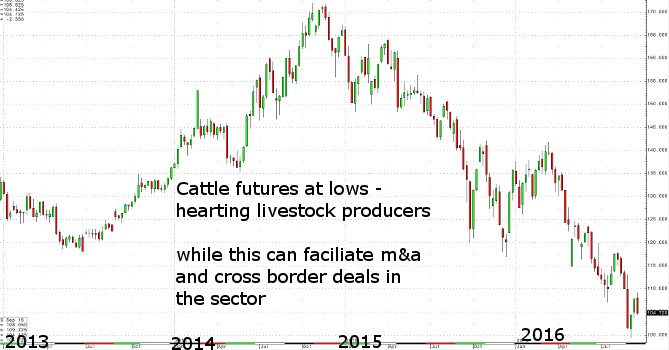
Source: ML
Chart: Most Profitable Weightings For AgriBusiness Basket - Momentum, Profitability and Risk
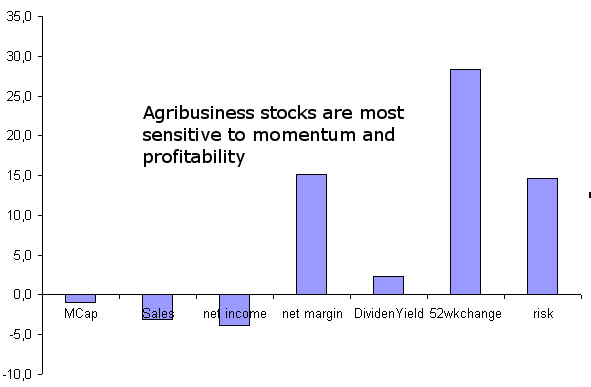
Source: ML
Chart: Kondratieff original stydy focuse on agri and other commodities
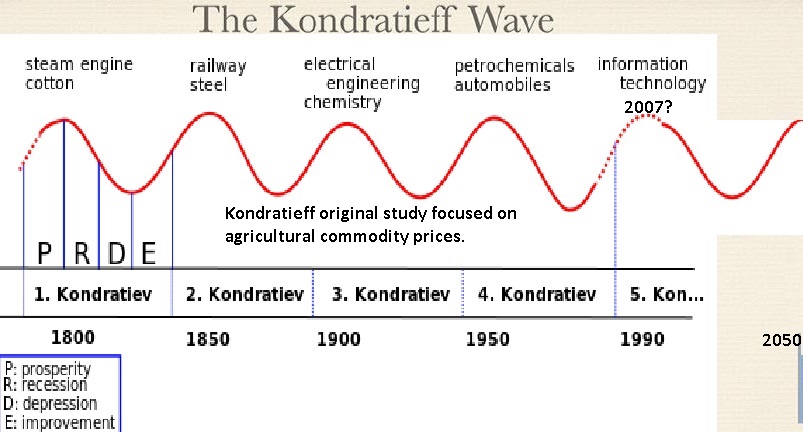
Source:
Chart: In 2013, the U.S. food and beverage manufacturing sector employed about 1.5 million people, or just over 1 percent of all U.S.
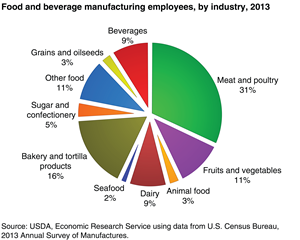
Source: USDA
Chart: In 2014, 17.3 million full- and part-time jobs were related to agriculture—about 9.3 percent of total U.S. employment.
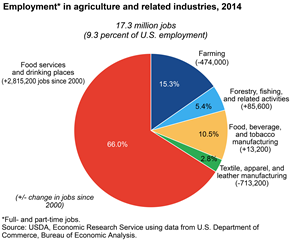
Source: USDA
Chart: Households spend 12.6-percent on food ranked third behind housing (33.3 percent) and transportation (17%)
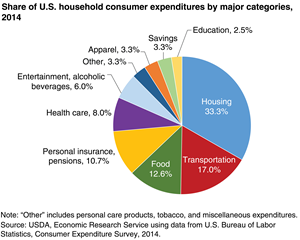
Source: USDA
Chart: Agriculture and agriculture-related industries contributed $835 billion to the U.S. gross domestic product (GDP) in 2014
a 4.8-percent share
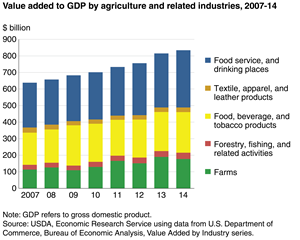
Source: USDA
Chart: More Crops are Used for Animal Feeds
Source: WorldBank
Chart: Ferts Consumption Made a Big Jump

Source: WorldBank
Chart: Despite That Land under Cereals Has been Flat for A while
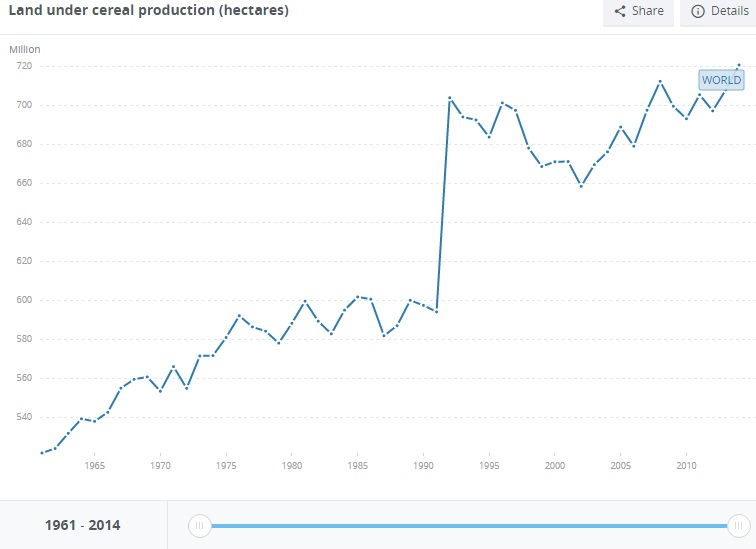
Source: WorldBank
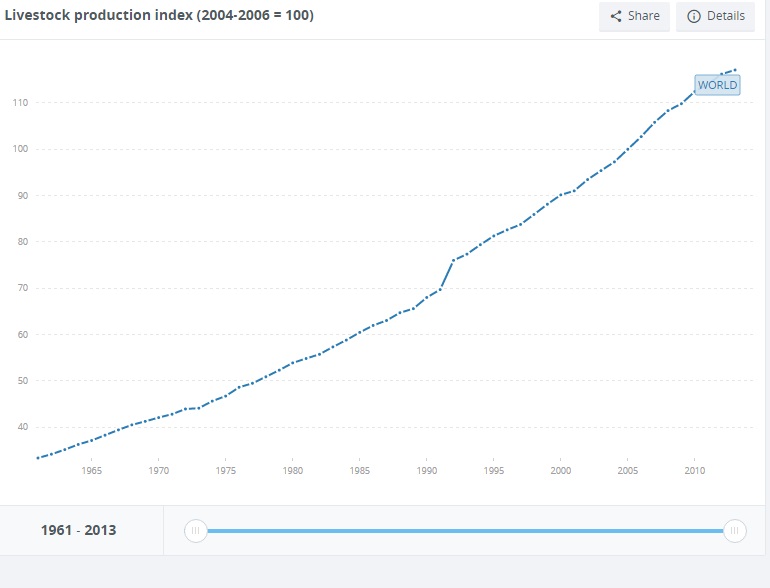
Chart: To Produce More Food
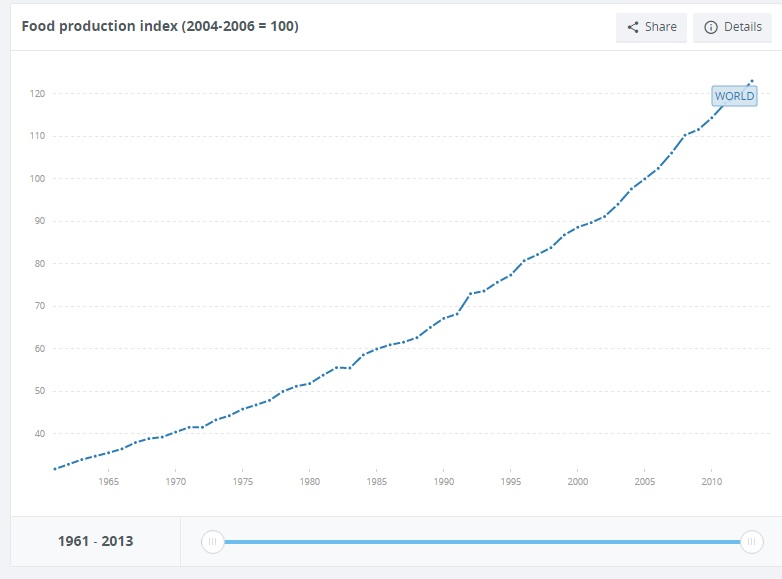
Source: WorldBank
Chart: And Crops are Rising
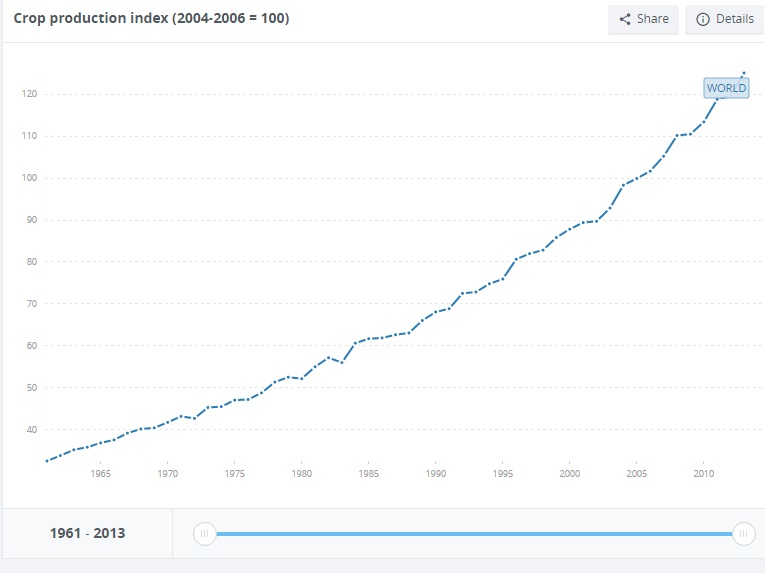
Source: WorldBank
Chart: Cereal Yields are on the Rise
As productivity improves
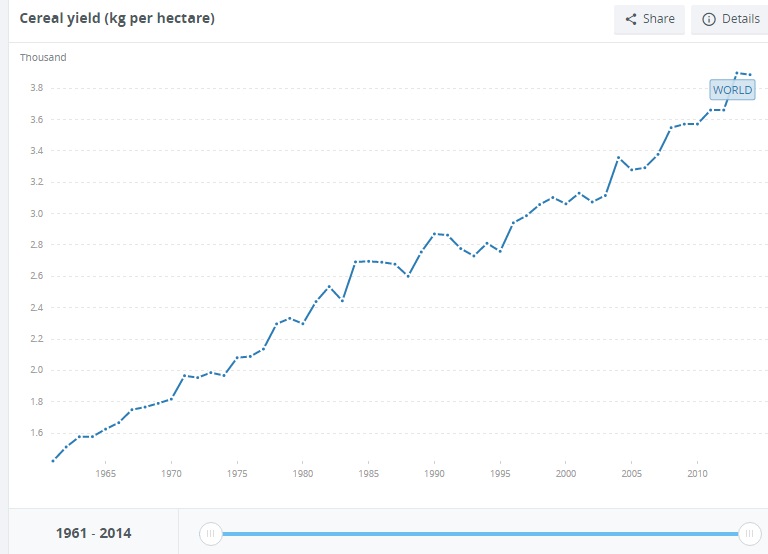
Source: WorldBank
Agriculture Finance
VIDEO: Agriculture dominates finance committee hearing in WinnipegCoca-Cola-led project lifts Thai women's skills in finance, agricultureNew finance firm targets agriculture and construction SMEsState should finance agriculture economyFood processing minister Harsimrat Kaur Badal discusses sector ...
Agricultural Land Prices
Structural changes in Germany as a result of climbing agricultural ...Letter: Let's set the record straight on proposed Grant County centerSolar panels on high-value farmland raise concernsMarin agricultural community's health to be assessed by new survey5 Ways to Turn Your Dream of Buying Farmland into Reality
Agricultural Commodities
Chicago agricultural commodities fallFoodies rejoice! Washington DC gets first Michelin restaurant guideGovernment urges Kenya Airways pilots to halt strikeDeere responds to US Justice Dept move to block acquisitionOrange Egypt seeks 4G licence under new terms
Fertilizers
Water-Soluble Fertilizers Market by Type, Application, Crop Type ...Abraaj buys stake in Indorama FertilizersUnderstanding the Fall in Phosphate Fertilizers in 2016Digital soil mapping project gives Ethiopian farmers new fertilizersYour Weekly Natural Gas Price Update for Nitrogen Fertilizers
Productivity in Agriculture
GAP Report: Agricultural Productivity Growth StallsAgricultural growth in emerging markets is falling short of global ...Lack of R&D funding threatens agricultural productivity: Australian ...World climate talks address agricultureClimate Change Adaptation – Key to Reaching Zero Hunger in Latin ...Country Composition
| Country | Weight % |
| United States | 28.13 |
| Malaysia | 12.50 |
| Russian Federation | 6.25 |
| Indonesia | 6.25 |
| Ukraine | 6.25 |
| United Kingdom | 6.25 |
| Canada | 6.25 |
| Chile | 3.13 |
| Switzerland | 3.13 |
| Taiwan | 3.13 |
| Hong Kong (SAR) | 3.13 |
| Norway | 3.13 |
| Australia | 3.13 |
| China | 3.13 |
| Singapore | 3.13 |
| France | 3.13 |
Loading graph...
/Sector Composition
| Country | Weight % |
| United States | 28.13 |
| Malaysia | 12.50 |
| Russian Federation | 6.25 |
| Indonesia | 6.25 |
| Ukraine | 6.25 |
| United Kingdom | 6.25 |
| Canada | 6.25 |
| Chile | 3.13 |
| Switzerland | 3.13 |
| Taiwan | 3.13 |
| Hong Kong (SAR) | 3.13 |
| Norway | 3.13 |
| Australia | 3.13 |
| China | 3.13 |
| Singapore | 3.13 |
| France | 3.13 |
Loading graph...
Key Basket Multiples
| Stocks | Total MCap US mn | Payout Ratio | Div Yield | PE | NetMargin | 1yr Return |
| 32 | | | | | | |
Results
2015-11-03 Archer-Daniels-Midland Co
Cons
ADM - Archer Daniels Midland Company: ADM to Release Third ...Archer-Daniels-Midland Company (NYSE:ADM) at $42.9: How much ...
2015-11-23 Tyson Foods Inc
Cons
3 Big Stock Charts: Mylan NV (MYL), Tyson Foods, Inc. (TSN) and ...Tyson Foods Inc. (TSN) Upgraded to "Sell" by Vetr Inc.
2015-11-25 Deere & Co
industr
Deere & Co. (DE) Price Target Increased to $68.00 by Analysts at ...Is It Safe to Buy Deere & Company Stock?
2015-11-03 Mosaic Co/The
mater
Mosaic (MOS) Q2 Earnings and Sales Miss EstimatesMosaic (MOS) Q2 Earnings and Sales Miss Estimates
2015-11-05 CF Industries Holdings Inc
mater
CF Industries Holdings, Inc. (NYSE:CF) topped earnings-per-share ...CF Industries Holdings, Inc. (NYSE:CF) Insiders Look Optimistic ...
| value | stock | Country | Industry | MCap US mn | DividendYield | PE | PS | NetMarginPct | PayoutRatio | 52wkchange | Score |
| Incitec Pivot Ltd | IPL:AU | Australia | Agricultural Chemicals | | 5.23% | 17.15 | 1.37 | 7.99 | 89.69 | -23.70 | 51.57 |
| Agrium Inc | AGU:CN | Canada | Agricultural Chemicals | | 3.92% | 13.88 | 0.88 | 6.34 | 54.41 | -0.87 | 40.73 |
| Potash Corp of Saskatchewan Inc | POT:CN | Canada | Agricultural Chemicals | | 2.51% | 17.41 | 2.61 | 14.99 | 43.70 | -19.03 | 16.98 |
| Sociedad Quimica y Minera de Chile SA | SQM/B:CI | Chile | Agricultural Chemicals | | 0.63% | 35.56 | 4.07 | 11.45 | 22.40 | 64.96 | 57.98 |
| China BlueChemical Ltd | 3983:HK | China | Agricultural Chemicals | | 6.10% | 33.25 | 0.63 | 1.89 | 202.83 | -26.75 | 139.46 |
| Eridania Beghin-Say | BG:LN | France | Agricultural Producers | | - | - | - | 0.00 | 0.00 | | |
| China Agri-Industries Holdings Ltd | 606:HK | Hong Kong (SAR) | Agricultural Producers | | - | - | 0.17 | 0.00 | 0.00 | -4.78 | -10.04 |
| Charoen Pokphand Indonesia Tbk PT | CPIN:IJ | Indonesia | Agricultural Producers | | 0.78% | 23.50 | 1.79 | 7.62 | 18.33 | 53.83 | 51.01 |
| Astra Agro Lestari Tbk PT | AALI:IJ | Indonesia | Agricultural Producers | | 0.67% | 25.20 | 2.00 | 7.94 | 16.88 | -17.63 | -23.28 |
| Felda Global Ventures Holdings Bhd | FGV:MK | Malaysia | Agricultural Producers | | 1.71% | - | 0.51 | 0.00 | -0.00 | 43.56 | 38.29 |
| PPB Group Bhd | PEP:MK | Malaysia | Agricultural Producers | | 1.54% | 24.03 | 4.53 | 18.85 | 37.01 | 5.32 | 31.88 |
| IOI Corp Bhd | IOI:MK | Malaysia | Agricultural Producers | | 1.79% | 44.45
| 2.40 | 5.40 | 79.57 | 4.07 | 39.32 |
| Genting Plantations Bhd | GENP:MK | Malaysia | Agricultural Producers | | 0.47% | 49.88 | 6.26 | 12.55 | 23.44 | 2.40 | -16.75 |
| Yara International ASA | YAR:NO | Norway | Agricultural Chemicals | | 5.71% | 6.99 | 0.71 | 10.16 | 39.91 | -19.82 | 18.00 |
| Ros Agro PLC | AGRO:LI | Russian Federation | Agricultural Products Whslrs | | 3.39% | 4.29 | 1.35 | 31.47 | 14.54 | 71.65 | 108.11 |
| Uralkali PJSC | URKA:RM | Russian Federation | Agricultural Chemicals | | - | 5.98 | 1.69 | 28.26 | -0.00 | -11.26 | 5.76 |
| Golden Agri-Resources Ltd | E5H:LI | Singapore | Agricultural Producers | | - | - | - | 0.00 | 0.00 | | |
| Syngenta AG | SYNN:VX | Switzerland | Agricultural Chemicals | | 2.62% | 33.12 | 3.04 | 9.18 | 86.77 | 42.40 | 99.97 |
| Taiwan Fertilizer Co Ltd | 1722:TT | Taiwan | Agricultural Chemicals | | 4.95% | 16.13 | 2.67 | 16.55 | 79.84 | 7.20 | 82.20 |
| Kernel Holding SA | 0KE:GR | Ukraine | Agricultural Producers | | 1.67% | - | - | 0.00 | -0.00 | 12.15 | 6.89 |
| MHP SA | MHPC:LI | Ukraine | Agricultural Producers | | 9.31 | 39.86 | 0.85 | 2.13 | 371.10 | 9.65 | 337.75 |
| CNH Industrial NV | CNHI:IM | United Kingdom | Agricultural Machinery | | 1.95% | - | - | 0.00 | -0.00 | 7.36 | 2.09 |
| Associated British Foods PLC | ABF:LN | United Kingdom | Packaged Food | | 1.45% | 25.75 | 1.52 | 5.90 | 37.34 | -20.36 | -8.14 |
| Tyson Foods Inc | TSN:US | United States | Packaged Food | | 0.83% | 16.65 | 0.74 | 4.44 | 13.82 | 60.00 | 56.35 |
| FMC Corp | FMC:US | United States | Agricultural Chemicals | | 1.43% | 20.00 | 1.86 | 9.30 | 28.60 | 29.50 | 42.13 |
| Monsanto Co | MON:US | United States | Agricultural Chemicals | | 2.10% | 22.07 | 3.34 | 15.13 | 46.35 | 17.60 | 51.74 |
| AGCO Corp | AGCO:US | United States | Agricultural Machinery | | 1.01% | 19.11 | 0.59 | 3.09 | 19.30 | 13.64 | 11.65 |
| Deere & Co | DE:US | United States | Agricultural Machinery | | 2.78% | 17.22 | 1.02 | 5.92 | 47.87 | 15.60 | 46.91 |
| Archer-Daniels-Midland Co | ADM:US | United States | Agricultural Producers | | 2.83% | 15.60 | 0.40 | 2.56 | 44.15 | -2.93 | 22.92 |
| Bunge Ltd | BG:US | United States | Agricultural Products Whslrs | | 2.79% | 11.91 | 0.21 | 1.76 | 33.23 | -20.31 | -2.49 |
| Mosaic Co/The | MOS:US | United States | Agricultural Chemicals | | 4.73% | 15.16 | 1.07 | 7.06 | 71.71 | -27.73 | 30.61 |
| CF Industries Holdings Inc | CF:US | United States | Agricultural Chemicals | | 5.21% | 14.76 | 1.28 | 8.67 | 76.90 | -53.03 | 12.52 |
Index Sector Valuations vs GEM Average
| Sector | Sector MCap US mn | Sector MCap Share in Total | Gem Sector Share In Total GEM | GEM Sector MCAP USmn | Payout Ratio | GEM Payout Ratio | Div Yield | GEM Div Yield | PE | PEGEM | PE Discount vs GEM | NetMargin | NetMarginGEM | Margin Diff. vs GEM | 1yr Return | GEM 1yr Return |
| Consumer Staples | | | 7.5 | 584775.3 | | 38.0 | | 1.8 | | 28.2 | | | 10.3 | | | 12.3 |
| Industrials | | | 5.8 | 453138.2 | | 23.4 | | 1.8 | | 18.6 | | | 11.4 | | | 22.9 |
| Materials | | | 7.6 | 590209.4 | | 27.5 | | 3.1 | | 18.1 | | | 9.8 | | | -0.1 |
Top 5 ML Agribusiness Long Picks
| value | stock | Country | Industry | MCapUSDmn | DividendYield | PE | PS | NetMarginPct | PayoutRatio | 52wkchange | Score |
| MHP SA | MHPC:LI | Ukraine | Agricultural Producers | | 9.31 | 39.86 | 0.85 | 2.13 | 371.10 | 9.65 | 337.75 |
| China BlueChemical Ltd | 3983:HK | China | Agricultural Chemicals | | 6.10% | 33.25 | 0.63 | 1.89 | 202.83 | -26.75 | 139.46 |
| Ros Agro PLC | AGRO:LI | Russian Federation | Agricultural Products Whslrs | | 3.39% | 4.29 | 1.35 | 31.47 | 14.54 | 71.65 | 108.11 |
| Syngenta AG | SYNN:VX | Switzerland | Agricultural Chemicals | | 2.62% | 33.12 | 3.04 | 9.18 | 86.77 | 42.40 | 99.97 |
| Taiwan Fertilizer Co Ltd | 1722:TT | Taiwan | Agricultural Chemicals | | 4.95% | 16.13 | 2.67 | 16.55 | 79.84 | 7.20 | 82.20 |
Top 5 ML Agribusiness Short Picks
| value | stock | Country | Industry | MCapUSDmn | DividendYield | PE | PS | NetMarginPct | PayoutRatio | 52wkchange | Score |
| Astra Agro Lestari Tbk PT | AALI:IJ | Indonesia | Agricultural Producers | | 0.67% | 25.20 | 2.00 | 7.94 | 16.88 | -17.63 | -25.21 |
| Genting Plantations Bhd | GENP:MK | Malaysia | Agricultural Producers | | 0.47% | 49.88 | 6.26 | 12.55 | 23.44 | 2.40 | -18.69 |
| China Agri-Industries Holdings Ltd | 606:HK | Hong Kong (SAR) | Agricultural Producers | | - | - | 0.17 | 0.00 | 0.00 | -4.78 | -11.98 |
| Associated British Foods PLC | ABF:LN | United Kingdom | Packaged Food | | 1.45% | 25.75 | 1.52 | 5.90 | 37.34 | -20.36 | -10.07 |
| Bunge Ltd | BG:US | United States | Agricultural Products Whslrs | | 2.79% | 11.91 | 0.21 | 1.76 | 33.23 | -20.31 | -4.43 |
xxxxxxxxxxxxxxxxxxxxxxxxxxxxxxxxxxx
xxxxxxxxxxxxxxxxxxxxxxxxxxxxxxxxxxx
Weekly Fund flow into Agri focused funds showed (Previous Week)1.9 USD mn of inflow
Top 10 Agri Focused Funds by Inflows Last Week
| Fund Name | fund flow mn$ | Total Assets mn$ | | ETFS AGRICULTURE DJ-UBSCI (AIGA) | 2.4 | 246.6 | | POWERSHARES GLOBAL AGRICULTURE (PSUU) | 0.0 | 5.7 | | MIRAE ROGERS AGRICULTURAL PRODUCT INDEX SPECIAL ASSET INVEST CMDTY-DERIVATIVE (5620974) | -0.3 | 69.7 |
Top 10 Agri Focused Funds by Outflow Last Week
| Fund Name | fund flow mn$ | Total Assets mn$ | | MIRAE ROGERS AGRICULTURAL PRODUCT INDEX SPECIAL ASSET INVEST CMDTY-DERIVATIVE (5620974) | -0.3 | 69.7 | | POWERSHARES GLOBAL AGRICULTURE (PSUU) | 0.0 | 5.7 | | ETFS AGRICULTURE DJ-UBSCI (AIGA) | 2.4 | 246.6 |
|
|