ML Agribusiness
By: Research Team

Description
Covering Global Agribusiness
Comment
Best last week among stocks was Charoen Pokphand Indonesia Tbk PT (CPIN:IJ) +11.31%, CF Industries Holdings Inc (CF:US) +6.93%, Sociedad Quimica y Minera de Chile SA (SQM/B:CI) +6.10%,
While worst last week among stocks was Kernel Holding SA (0KE:GR) -3.84%, Astra Agro Lestari Tbk PT (AALI:IJ) -2.47%, Genting Plantations Bhd (GENP:MK) -2.30%,
Best last month among stocks was Felda Global Ventures Holdings Bhd (FGV:MK) +7.94%, Charoen Pokphand Indonesia Tbk PT (CPIN:IJ) +6.53%, Incitec Pivot Ltd (IPL:AU) +4.64%,
While worst last month among stocks was Associated British Foods PLC (ABF:LN) -20.30%, Mosaic Co/The (MOS:US) -14.80%, Potash Corp of Saskatchewan Inc (POT:CN) -10.13%,
Best YTD among stocks was Charoen Pokphand Indonesia Tbk PT (CPIN:IJ) +55.05%, Sociedad Quimica y Minera de Chile SA (SQM/B:CI) +50.31%, Felda Global Ventures Holdings Bhd (FGV:MK) +48.49%,
While worst YTD among stocks was CF Industries Holdings Inc (CF:US) -38.59%, Associated British Foods PLC (ABF:LN) -31.89%, China BlueChemical Ltd (3983:HK) -28.30%,
Chart: Most Profitable Weightings For AgriBusiness Basket - Momentum, Profitability and Risk
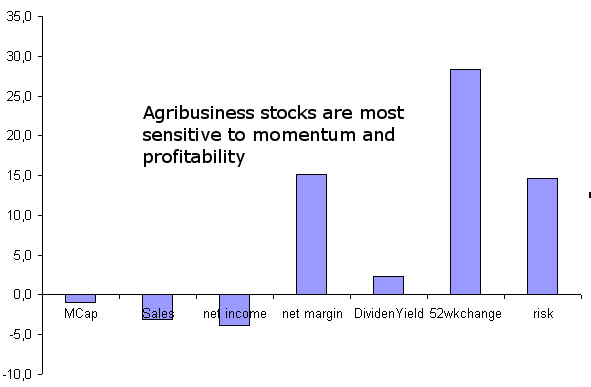
Source: ML
Chart: Kondratieff original stydy focuse on agri and other commodities
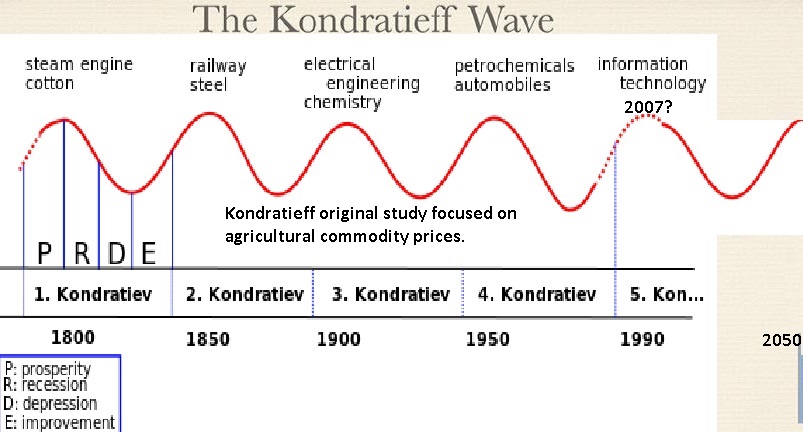
Source:
Chart: In 2013, the U.S. food and beverage manufacturing sector employed about 1.5 million people, or just over 1 percent of all U.S.
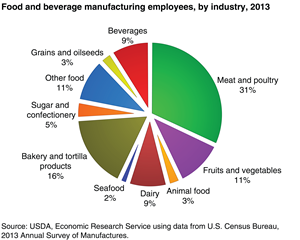
Source: USDA
Chart: In 2014, 17.3 million full- and part-time jobs were related to agriculture—about 9.3 percent of total U.S. employment.
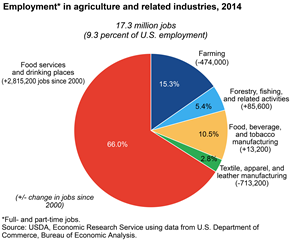
Source: USDA
Chart: Households spend 12.6-percent on food ranked third behind housing (33.3 percent) and transportation (17%)
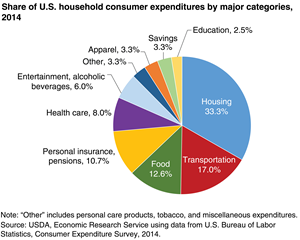
Source: USDA
Chart: Agriculture and agriculture-related industries contributed $835 billion to the U.S. gross domestic product (GDP) in 2014
a 4.8-percent share
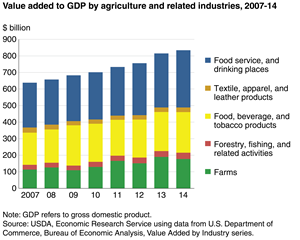
Source: USDA
Chart: More Crops are Used for Animal Feeds
Source: WorldBank
Chart: Ferts Consumption Made a Big Jump

Source: WorldBank
Chart: Despite That Land under Cereals Has been Flat for A while
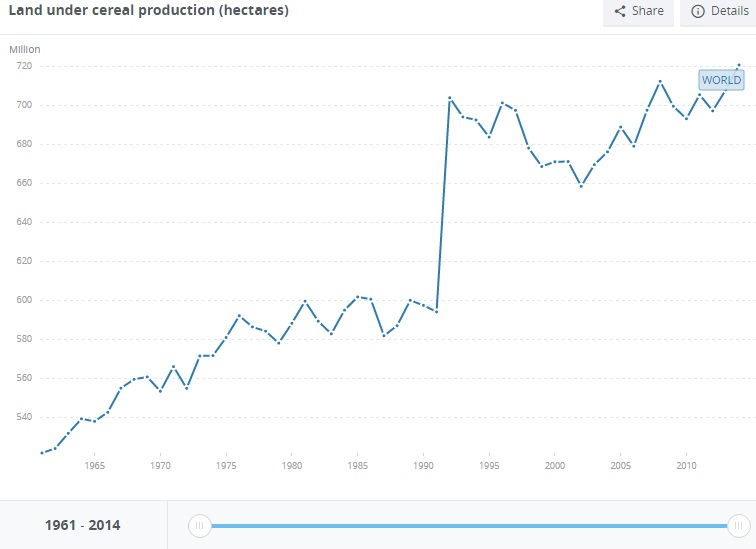
Source: WorldBank
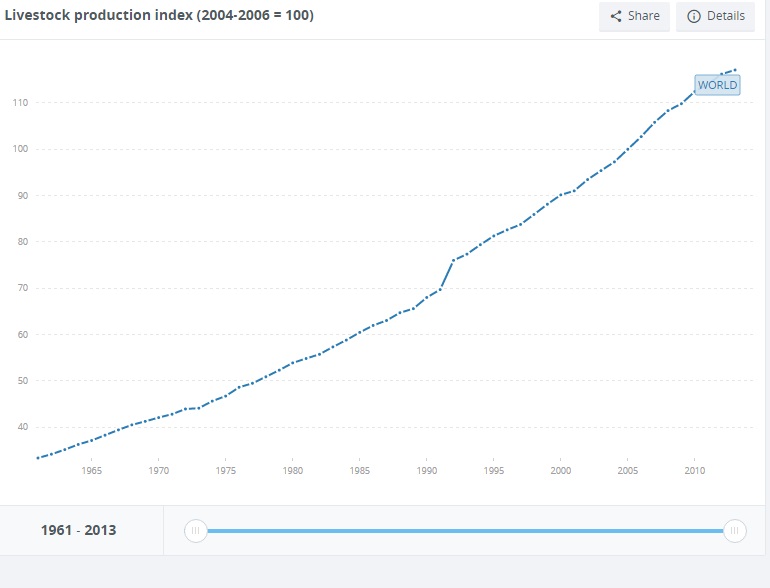
Chart: To Produce More Food
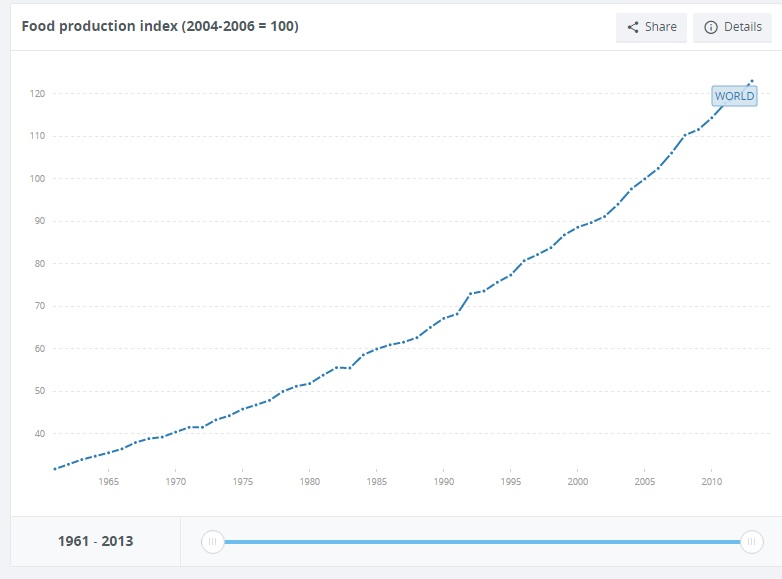
Source: WorldBank
Chart: And Crops are Rising
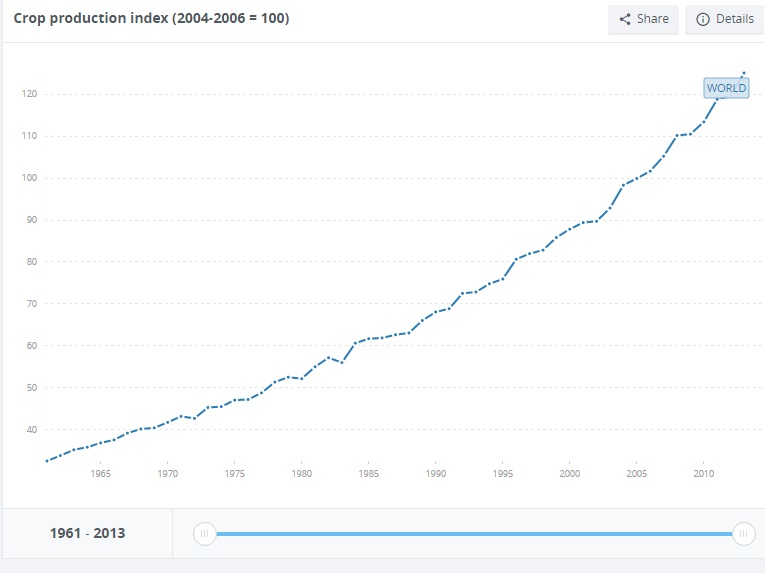
Source: WorldBank
Chart: Cereal Yields are on the Rise
As productivity improves
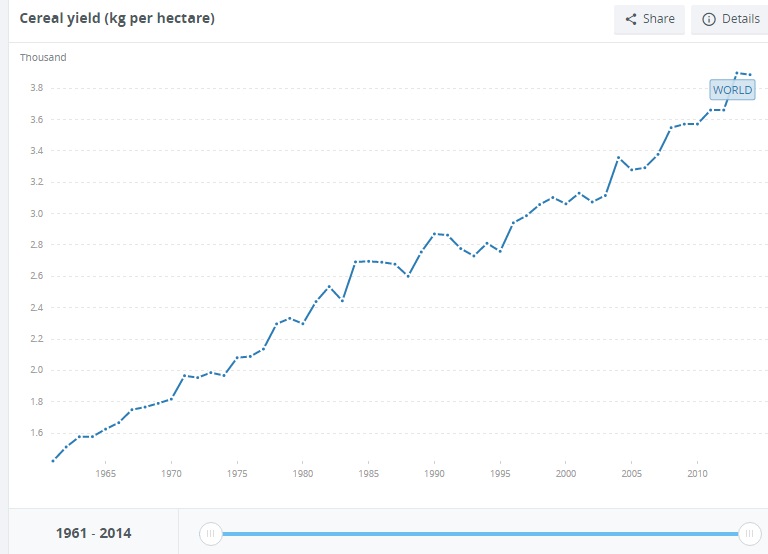
Source: WorldBank
Chart: But Arable Land Per Capital of Global Population is Rapidly Declining
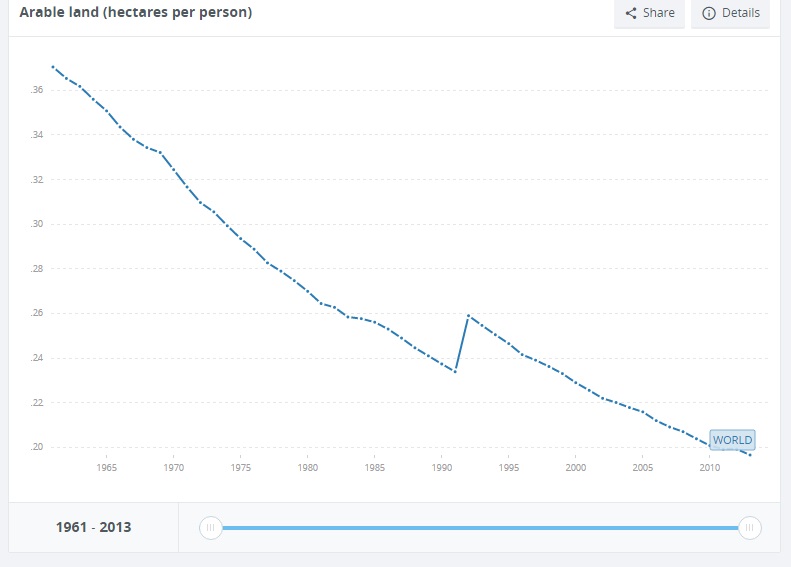
Source: WorldBank
Agriculture Finance
EDITORIAL: Finance agriculture to develop AfricaCoca-Cola-led project lifts Thai women's skills in finance, agricultureState should finance agriculture economyFrom asset finance to 'access' financeAgrobank's Wan Mohd Fadzmi named 'CEO of the Year'
Agricultural Land Prices
Farmland: A Macro PerspectiveAging farmers will turn over two-thirds of Oregon's ag landAdecoagro's Valuation Looks A Little Too SourCosts Fail to Match Plunge in RevenuesKings, Stanislaus reflect 'drag' in California crop values
Agricultural Commodities
Nigeria on roadshow to promote $1 billion EurobondUSDA to hire veterans as ag commodity gradersGRAINS-Soybean rally snuffed out as US harvest advancesHouse passes bill to set up agricultural commodities regulatory ...REFILE-PRECIOUS-Gold slides to lowest since Brexit vote
Fertilizers
India Chemical Fertilizers Market Outlook, 2021: Fertilizers Nurturing ...Brazil's Vale intends to form partnership in fertilizersRwanda: Govt Creates Scheme to Curb Fraud in Fertilizer DistributionFertilizers Come Back to EarthGNFC, Belgium's Ecophos to set up Rs 526 crore fertilizers plant in ...
Productivity in Agriculture
Modernising agriculture sector: Raising productivityAfrica: CAADP Enables African Countries Increase Agriculture ...Mabaya is president of African agricultural economists groupTanzania: Coffee and Flower Growers Turn to Organic FarmingBiggest Robot Dairy in Asia Setting Up Japan's Milk RevivalCountry Composition
| Country | Weight % |
| United States | 28.13 |
| Malaysia | 12.50 |
| Indonesia | 6.25 |
| Ukraine | 6.25 |
| United Kingdom | 6.25 |
| Canada | 6.25 |
| Russian Federation | 6.25 |
| Chile | 3.13 |
| Switzerland | 3.13 |
| Taiwan | 3.13 |
| France | 3.13 |
| Singapore | 3.13 |
| Hong Kong (SAR) | 3.13 |
| Norway | 3.13 |
| China | 3.13 |
| Australia | 3.13 |
Loading graph...
/Sector Composition
| Country | Weight % |
| United States | 28.13 |
| Malaysia | 12.50 |
| Indonesia | 6.25 |
| Ukraine | 6.25 |
| United Kingdom | 6.25 |
| Canada | 6.25 |
| Russian Federation | 6.25 |
| Chile | 3.13 |
| Switzerland | 3.13 |
| Taiwan | 3.13 |
| France | 3.13 |
| Singapore | 3.13 |
| Hong Kong (SAR) | 3.13 |
| Norway | 3.13 |
| China | 3.13 |
| Australia | 3.13 |
Loading graph...
Key Basket Multiples
| Stocks | Total MCap US mn | Payout Ratio | Div Yield | PE | NetMargin | 1yr Return |
| 32 | 658364.9 | 58.2 | 3.5 | 18.66 | 7.98 | -0.9 |
Results
2015-11-03 Archer-Daniels-Midland Co
Cons
Archer-Daniels-Midland Company (NYSE:ADM) at $42.9: How much ...Cargill profit jumps on beef demand, better grain margins
2015-11-23 Tyson Foods Inc
Cons
Cargill fiscal first-quarter earnings rise 66 percentTyson Foods, Inc. (NYSE:TSN) at $74.83: How much higher it can go
2015-11-25 Deere & Co
industr
Terex (TEX) Downgraded to Strong Sell: Time to Offload It?Deere & Company (NYSE:DE) Insider Activities Are in the Air
2015-11-03 Mosaic Co/The
mater
Vertical Research Downgrades Mosaic Co to SellMosaic (MOS) Q2 Earnings and Sales Miss Estimates
2015-11-05 CF Industries Holdings Inc
mater
CF Industries Holdings, Inc. (NYSE:CF) Earnings Preview: Should ...CF Industries Holdings, Inc. (NYSE:CF) Earnings Preview: Should ...
| value | stock | Country | Industry | MCap US mn | DividendYield | PE | PS | NetMarginPct | PayoutRatio | 52wkchange | Score |
| Incitec Pivot Ltd | IPL:AU | Australia | Agricultural Chemicals | 3679.08 | 2.85 | 16.80 | 1.34 | 7.98 | 47.88 | -30.22 | 4.87 |
| Agrium Inc | AGU:CN | Canada | Agricultural Chemicals | 12287.54 | 3.96% | 13.76 | 0.87 | 6.32 | 54.49 | 2.63 | 45.71 |
| Potash Corp of Saskatchewan Inc | POT:CN | Canada | Agricultural Chemicals | 13516.60 | 2.48% | 17.36 | 2.61 | 15.03 | 43.05 | -15.64 | 21.11 |
| Sociedad Quimica y Minera de Chile SA | SQM/B:CI | Chile | Agricultural Chemicals | 7294.30 | 0.63% | 35.99 | 4.14 | 11.50 | 22.67 | 79.42 | 73.64 |
| China BlueChemical Ltd | 3983:HK | China | Agricultural Chemicals | 861.94 | 6.52% | 30.91 | 0.59 | 1.91 | 201.53 | -27.93 | 140.63 |
| Eridania Beghin-Say | BG:LN | France | Agricultural Producers | 0.00 | - | - | - | 0.00 | 0.00 | 0.00 | -3.97 |
| China Agri-Industries Holdings Ltd | 606:HK | Hong Kong (SAR) | Agricultural Producers | 1895.36 | - | - | 0.17 | 0.00 | 0.00 | -3.45 | -7.42 |
| Charoen Pokphand Indonesia Tbk PT | CPIN:IJ | Indonesia | Agricultural Producers | 4760.14 | 0.77% | 23.88 | 1.82 | 7.62 | 18.39 | 68.96 | 67.12 |
| Astra Agro Lestari Tbk PT | AALI:IJ | Indonesia | Agricultural Producers | 2226.69 | 0.66% | 25.63 | 2.04 | 7.96 | 16.92 | -24.35 | -29.07 |
| Felda Global Ventures Holdings Bhd | FGV:MK | Malaysia | Agricultural Producers | 2123.34 | 1.67% | - | 0.53 | 0.00 | -0.00 | 65.84 | 61.87 |
| IOI Corp Bhd | IOI:MK | Malaysia | Agricultural Producers | 1524.84 | 1.77% | 45.05 | 2.43 | 5.39 | 79.74 | 10.99 | 47.10 |
| PPB Group Bhd | PEP:MK | Malaysia | Agricultural Producers | 4640.01 | 1.55% | 23.82 | 4.49 | 18.85 | 36.92 | 7.08 | 35.06 |
| Genting Plantations Bhd | GENP:MK | Malaysia | Agricultural Producers | 2047.43 | 0.47% | 50.26 | 6.30 | 12.53 | 23.62 | 4.50 | -13.57 |
| Yara International ASA | YAR:NO | Norway | Agricultural Chemicals | 9233.47 | 5.56% | 7.18 | 0.73 | 10.17 | 39.92 | -17.22 | 21.72 |
| Uralkali PJSC | URKA:RM | Russian Federation | Agricultural Chemicals | 8478.31 | - | 6.55 | 1.84 | 28.09 | -0.00 | -1.47 | 16.11 |
| Ros Agro PLC | AGRO:LI | Russian Federation | Agricultural Products Whslrs | 1811.00 | 3.47% | 4.16 | 1.31 | 31.49 | 14.44 | 67.85 | 105.64 |
| Golden Agri-Resources Ltd | E5H:LI | Singapore | Agricultural Producers | 0.00 | - | - | - | 0.00 | 0.00 | 0.04 | -3.93 |
| Syngenta AG | SYNN:VX | Switzerland | Agricultural Chemicals | 40901.45 | 2.55% | 34.19 | 3.14 | 9.18 | 87.18 | 40.94 | 99.15 |
| Taiwan Fertilizer Co Ltd | 1722:TT | Taiwan | Agricultural Chemicals | 1327.07 | 4.95% | 16.14 | 2.67 | 16.54 | 79.89 | 8.85 | 85.18 |
| Kernel Holding SA | 0KE:GR | Ukraine | Agricultural Producers | 1160.73 | 1.70% | - | - | 0.00 | -0.00 | 31.49 | 27.51 |
| MHP SA | MHPC:LI | Ukraine | Agricultural Producers | 970.02 | 8.20% | 39.31 | 0.84 | 2.14 | 322.34 | 3.66 | 284.86 |
| CNH Industrial NV | CNHI:IM | United Kingdom | Agricultural Machinery | 9768.30 | 2.01% | - | - | 0.00 | -0.00 | 10.72 | 6.75 |
| Associated British Foods PLC | ABF:LN | United Kingdom | Packaged Food | 26803.24 | 1.34% | 27.88 | 1.64 | 5.88 | 37.36 | -17.84 | -6.45 |
| Tyson Foods Inc | TSN:US | United States | Packaged Food | 29688.00 | 0.81% | 17.09 | 0.76 | 4.45 | 13.84 | 67.80 | 65.03 |
| FMC Corp | FMC:US | United States | Agricultural Chemicals | 6343.00 | 1.39% | 20.49 | 1.89 | 9.22 | 28.48 | 36.76 | 50.00 |
| Monsanto Co | MON:US | United States | Agricultural Chemicals | 44915.00 | 2.11% | 23.32 | 3.43 | 14.71 | 49.21 | 20.46 | 57.08 |
| Deere & Co | DE:US | United States | Agricultural Machinery | 26915.00 | 2.80% | 17.08 | 1.00 | 5.85 | 47.82 | 18.78 | 51.41 |
| AGCO Corp | AGCO:US | United States | Agricultural Machinery | 3980.00 | 1.06% | 18.28 | 0.57 | 3.12 | 19.38 | 12.44 | 12.68 |
| Archer-Daniels-Midland Co | ADM:US | United States | Agricultural Producers | 25007.00 | 2.79% | 15.84 | 0.41 | 2.59 | 44.19 | 4.17 | 31.14 |
| Mosaic Co/The | MOS:US | United States | Agricultural Chemicals | 350195.00 | 4.43% | 16.17 | 1.14 | 7.05 | 71.63 | -17.25 | 41.29 |
| Bunge Ltd | BG:US | United States | Agricultural Products Whslrs | 8330.00 | 2.81% | 11.82 | 0.20 | 1.69 | 33.21 | -17.68 | 1.44 |
| CF Industries Holdings Inc | CF:US | United States | Agricultural Chemicals | 5681.00 | 4.93% | 15.61 | 1.36 | 8.71 | 76.96 | -46.20 | 19.89 |
Index Sector Valuations vs GEM Average
| Sector | Sector MCap US mn | Sector MCap Share in Total | Gem Sector Share In Total GEM | GEM Sector MCAP USmn | Payout Ratio | GEM Payout Ratio | Div Yield | GEM Div Yield | PE | PEGEM | PE Discount vs GEM | NetMargin | NetMarginGEM | Margin Diff. vs GEM | 1yr Return | GEM 1yr Return |
| Consumer Staples | 112987.8 | 17.2 | 7.5 | 584775.3 | 29.3 | 38.0 | 1.7 | 1.8 | 20.8 | 28.2 | -26.2 | 5.6 | 10.3 | 4.7 | 18.8 | 12.3 |
| Industrials | 40663.3 | 6.2 | 5.8 | 453138.2 | 33.6 | 23.4 | 2.4 | 1.8 | 17.2 | 18.6 | -7.5 | 5.5 | 11.4 | 5.9 | 16.2 | 22.9 |
| Materials | 504713.8 | 76.7 | 7.6 | 590209.4 | 66.6 | 27.5 | 3.9 | 3.1 | 18.3 | 18.1 | 1.1 | 8.6 | 9.8 | 1.2 | -6.7 | -0.1 |
Top 5 ML Agribusiness Long Picks
| value | stock | Country | Industry | MCapUSDmn | DividendYield | PE | PS | NetMarginPct | PayoutRatio | 52wkchange | Score |
| MHP SA | MHPC:LI | Ukraine | Agricultural Producers | 970.02 | 8.20% | 39.31 | 0.84 | 2.14 | 322.34 | 3.66 | 284.86 |
| China BlueChemical Ltd | 3983:HK | China | Agricultural Chemicals | 861.94 | 6.52% | 30.91 | 0.59 | 1.91 | 201.53 | -27.93 | 140.63 |
| Ros Agro PLC | AGRO:LI | Russian Federation | Agricultural Products Whslrs | 1811.00 | 3.47% | 4.16 | 1.31 | 31.49 | 14.44 | 67.85 | 105.64 |
| Syngenta AG | SYNN:VX | Switzerland | Agricultural Chemicals | 40901.45 | 2.55% | 34.19 | 3.14 | 9.18 | 87.18 | 40.94 | 99.15 |
| Taiwan Fertilizer Co Ltd | 1722:TT | Taiwan | Agricultural Chemicals | 1327.07 | 4.95% | 16.14 | 2.67 | 16.54 | 79.89 | 8.85 | 85.18 |
Top 5 ML Agribusiness Short Picks
| value | stock | Country | Industry | MCapUSDmn | DividendYield | PE | PS | NetMarginPct | PayoutRatio | 52wkchange | Score |
| Astra Agro Lestari Tbk PT | AALI:IJ | Indonesia | Agricultural Producers | 2226.69 | 0.66% | 25.63 | 2.04 | 7.96 | 16.92 | -24.35 | -29.84 |
| Genting Plantations Bhd | GENP:MK | Malaysia | Agricultural Producers | 2047.43 | 0.47% | 50.26 | 6.30 | 12.53 | 23.62 | 4.50 | -14.34 |
| China Agri-Industries Holdings Ltd | 606:HK | Hong Kong (SAR) | Agricultural Producers | 1895.36 | - | - | 0.17 | 0.00 | 0.00 | -3.45 | -8.18 |
| Associated British Foods PLC | ABF:LN | United Kingdom | Packaged Food | 26803.24 | 1.34% | 27.88 | 1.64 | 5.88 | 37.36 | -17.84 | -7.21 |
| Eridania Beghin-Say | BG:LN | France | Agricultural Producers | 0.00 | - | - | - | 0.00 | 0.00 | 0.00 | -4.73 |
xxxxxxxxxxxxxxxxxxxxxxxxxxxxxxxxxxx
xxxxxxxxxxxxxxxxxxxxxxxxxxxxxxxxxxx
Weekly Fund flow into Agri focused funds showed (Previous Week)16.9 USD mn of inflow
Top 10 Agri Focused Funds by Inflows Last Week
| Fund Name | fund flow mn$ | Total Assets mn$ | | ETFS AGRICULTURE DJ-UBSCI (AIGA) | 15.3 | 241.7 | | POWERSHARES GLOBAL AGRICULTURE (PSUU) | 0.0 | 5.7 |
Top 10 Agri Focused Funds by Outflow Last Week
| Fund Name | fund flow mn$ | Total Assets mn$ | | POWERSHARES GLOBAL AGRICULTURE (PSUU) | 0.0 | 5.7 | | ETFS AGRICULTURE DJ-UBSCI (AIGA) | 15.3 | 241.7 |
|
|