Indexes
Currencies
Commodities
Rates
Index Performance
Changes between 2016-09-29 and 2016-09-26
| Ndex | Last | WkChPct | |
| Borsa Istanbul 100 Index | 76360.71 | -4.26 | |
| S&P BSE SENSEX Index | 27887.24 | -2.72 | |
| Deutsche Boerse AG German Stoc | 10405.54 | -2.52 | |
| MICEX Index | 1977.62 | -1.70 | |
| Shanghai Stock Exchange Compos | 2998.483 | -1.44 | |
| Warsaw Stock Exchange WIG Tota | 47322.03 | -1.14 | |
| Ibovespa Brasil Sao Paulo Stoc | 58350.57 | -1.09 | |
| Russian Trading System Cash In | 983.15 | -1.09 | |
| Nikkei 225 | 16693.71 | -0.68 | |
| Mexican Stock Exchange Mexican | 47672.07 | -0.63 | |
| Korea Stock Exchange KOSPI Ind | 2043.63 | -0.51 | |
| Jakarta Stock Exchange Composi | 5364.804 | -0.45 | |
| Russian Depositary Index USD | 1161.63 | -0.37 | |
| S&P/TSX Composite Index | 14754.55 | -0.29 | |
| Hong Kong Hang Seng Index | 23739.47 | -0.09 | |
| FTSE 100 Index | 6919.42 | 0.12 | |
| Dow Jones Industrial Average | 18339.24 | 0.25 | |
| S&P 500 Index | 2171.37 | 0.38 | |
| FTSE/JSE Africa All Share Inde | 52257.97 | 0.50 | |
| Karachi Stock Exchange KSE100 | 40440.95 | 1.66 |
Weekly Currency Performance
| Currency | Last | WkChPct | |
| RUB | 63.3568 | -1.13 | |
| NOK | 8.052 | -0.75 | |
| KZT | 335.72 | -0.64 | |
| AZN | 1.6415 | -0.48 | |
| PKR | 104.58 | -0.19 | |
| EUR | 0.891 | -0.13 | |
| KRW | 1101.13 | -0.12 | |
| INR | 66.6125 | -0.06 | |
| CNY | 6.6672 | 0.04 | |
| AUD | 1.3096 | 0.10 | |
| JPY | 101.03 | 0.27 | |
| LVL | 0.62879 | 0.43 | |
| CAD | 1.3146 | 0.80 | |
| ZAR | 13.8813 | 1.19 | |
| BRL | 3.2597 | 1.21 | |
| TRY | 3.0057 | 1.24 |
Weekly Commodities Performance
| name | last | WeekCh | |
| COCOA (ICE) | 2722.0 | -4.56 | |
| LIVE CATTLE (CME) | 103.125 | -3.58 | |
| COTTON #2 (ICE) | 68.1 | -2.81 | |
| SILVER (COMEX) | 19.335 | -2.40 | |
| PLATINUM SPOT | 1034.35 | -1.86 | |
| GOLD (COMEX) | 1329.8 | -0.89 | |
| GOLD SPOT | 1326.81 | -0.80 | |
| COPPER (COMEX) | 218.95 | -0.52 | |
| NATURAL GAS (NYMEX) | 2.95 | -0.17 | |
| RBOB GASOLINE (NYMEX) | 144.34 | 4.83 | |
| BRENT CRUDE (ICE) | 48.21 | 5.06 | |
| WTI CRUDE OIL (NYMEX) | 47.14 | 5.98 | |
| HEATING OIL (NYMEX) | 149.24 | 6.05 |
Weekly Bond Rates Performance Change in btps
Weekly GEM Sov. Bond Rates Performance Change in btps
Data in this table is from last Thursday Fixed Income update
| Country | Average Yield | Yield Average change % pts | |
| El Salvador | 7.36 | 0.09 | |
| Ukraine | 8.27 | 0.05 | |
| Trinidad and Tobago | 4.12 | 0.05 | |
| Slovak Republic | 1.79 | 0.04 | |
| United States | 0.53 | 0.00 | |
| Lithuania | 1.98 | -0.03 | |
| Malaysia | 3.47 | -0.04 | |
| Pakistan | 5.05 | -0.04 | |
| China | 2.40 | -0.06 | |
| Poland | 2.30 | -0.08 | |
| Mexico | 4.08 | -0.10 | |
| Tunisia | 5.94 | -0.10 | |
| Uruguay | 3.87 | -0.10 | |
| India | 3.26 | -0.12 | |
| Chile | 2.87 | -0.13 | |
| Oman | 4.00 | -0.16 | |
| Philippines | 2.51 | -0.16 | |
| Russian Federation | 3.83 | -0.17 | |
| Paraguay | 5.22 | -0.17 | |
| Morocco | 3.10 | -0.17 | |
| Romania | 2.98 | -0.18 | |
| Cote D'Ivoire (Ivory Coast) | 5.71 | -0.19 | |
| Costa Rica | 5.88 | -0.20 | |
| Lebanon | 6.51 | -0.20 | |
| Croatia (Hrvatska) | 3.38 | -0.21 | |
| Vietnam | 3.88 | -0.22 | |
| Kazakhstan | 4.32 | -0.22 | |
| Serbia | 3.26 | -0.22 | |
| Jamaica | 5.63 | -0.23 | |
| Indonesia | 3.67 | -0.23 | |
| Panama | 2.82 | -0.24 | |
| Dominican Republic | 5.01 | -0.25 | |
| Peru | 3.29 | -0.27 | |
| Azerbaijan | 4.78 | -0.29 | |
| Iraq | 9.02 | -0.29 | |
| Brazil | 4.53 | -0.30 | |
| Turkey | 4.39 | -0.30 | |
| Egypt | 5.63 | -0.30 | |
| Hungary | 2.92 | -0.31 | |
| Colombia | 3.57 | -0.31 | |
| South Africa | 4.20 | -0.41 | |
| Argentina | 5.82 | -0.42 | |
| Sri Lanka | 5.17 | -0.45 | |
| Kenya | 6.83 | -0.47 | |
| Ethiopia | 6.62 | -0.49 | |
| Ecuador | 9.81 | -0.49 | |
| Zambia | 8.54 | -0.63 | |
| Angola | 9.13 | -0.64 | |
| Gabon | 7.61 | -0.70 | |
| Ghana | 8.95 | -0.71 | |
| Mongolia | 7.69 | -0.79 | |
| Venezuela | 23.52 | -1.71 |
Chart: OPEC has agreed to set a ceiling on oil output somewhere between 32.5 million and 33 million barrels per day � down from current levels of 33.5 - Nigeria, Libia and Iran showed biggest rises to production so far this year. But the ceiling is most likely affect already battered Saudi Arabia, IRAQ and Abu-Dhabi
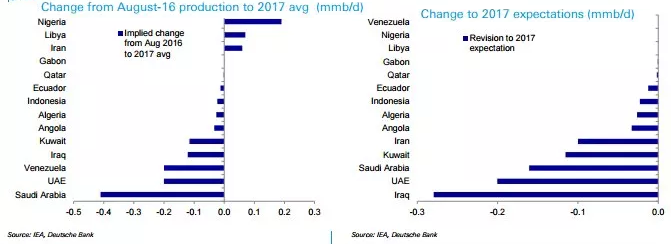
Source: VOX, DB
Market Comment Political & Economic News Today's Economic Events Today's Stock Results Recent ML Reports
Key Comment
Best since the start of the week among various stock markets was Karachi Stock Exchange KSE100 Index +1.66%, FTSE/JSE Africa All Share Index +0.50%, S&P 500 Index +0.38%, Dow Jones Industrial Average +0.25%,
While worst since the start of the week among various stock markets was Borsa Istanbul 100 Index -4.26%, S&P BSE SENSEX Index -2.72%, Deutsche Boerse AG German Stock Index DAX -2.52%, MICEX Index -1.70%,
Best week to date in FX space vs. greenback was TRY +1.24%, BRL +1.21%, ZAR +1.19%,
While worst week to date in FX space vs. greenback was RUB -1.13%, NOK -0.75%, KZT -0.64%,
Best among commodities versus last Friday close was HEATING OIL (NYMEX) +6.05%, WTI CRUDE OIL (NYMEX) +5.98%, BRENT CRUDE (ICE) +5.06%,
While worst among commodities versus last Friday close was COCOA (ICE) -4.56%, LIVE CATTLE (CME) -3.58%, COTTON #2 (ICE) -2.81%,
News
China
South Africa
Australia
Korea
India
Canada
Turkey
Brazil
Russia
Econ Events Today
2016-09-30 EU Inflation Rate YoY Flash
2016-09-30 Japan Core Inflation Rate YoY
2016-09-30 US Michigan Consumer Sentiment Final
2016-09-30 EU Core Inflation Rate YoY Flash
2016-09-30 EU Unemployment Rate
2016-09-30 Japan Inflation Rate YoY
2016-09-30 Japan Industrial Production MoM Prel
2016-09-30 Japan Industrial Production YoY Prel
2016-09-30 Japan Construction Orders YoY
2016-09-30 Japan Housing Starts YoY
2016-09-30 Japan Inflation Rate MoM
2016-09-30 Japan Jobs/applications ratio
2016-09-30 Japan Household Spending MoM
2016-09-30 Japan Household Spending YoY
2016-09-30 Japan Unemployment Rate
2016-09-30 Japan Inflation Rate Ex-Food and Energy YoYAUG
2016-09-30 Japan Tokyo CPI YoY
2016-09-30 Japan Tokyo Core CPI YoY
2016-09-30 China Caixin Manufacturing PMI
2016-09-30 Turkey Balance of Trade
2016-09-30 South Africa M3 Money Supply YoY
2016-09-30 South Africa Private Sector Credit YoY
2016-09-30 South Africa Consumer Confidence
2016-09-30 South Africa Total New Vehicle Sales
2016-09-30 South Africa Balance of Trade
2016-09-30 BRazil Unemployment Rate
2016-09-30 BRazil Nominal Budget Balance
2016-09-30 India Government Budget Value
2016-09-30 India External Debt
2016-09-30 India Deposit Growth YoY
2016-09-30 India Bank Loan Growth
2016-09-30 India Foreign Reserves
2016-09-30 India Infrastructure Output YoY
2016-09-30 Canada PPI YoY
2016-09-30 Canada PPI MoM
2016-09-30 Canada GDP MoM
2016-09-30 Canada Budget Balance
2016-09-30 Australia HIA New Home Sales MoM
2016-09-30 Australia Private Sector Credit MoM
2016-09-30 Australia Private Sector Credit YoY
2016-09-30 US Fed Yellen Speech
2016-09-30 US Fed George Speech
2016-09-30 US Core PCE Price Index YoY
2016-09-30 US Core PCE Price Index MoM
2016-09-30 US PCE Price Index MoM
2016-09-30 US PCE Price Index YoY
2016-09-30 US Personal Spending MoM
2016-09-30 US Personal Income MoM
2016-09-30 US Chicago PMI
Econ Events Yesterday
2016-09-29 Japan Foreign Bond Investment
2016-09-29 EU Economic Sentiment
2016-09-29 EU Consumer Confidence Final
2016-09-29 EU Business Confidence
2016-09-29 EU Industrial Sentiment
2016-09-29 EU Services Sentiment
2016-09-29 EU ECB Praet Speech
2016-09-29 EU ECB Const?ncio Speech
2016-09-29 Japan Retail Sales YoY
2016-09-29 Japan BoJ Gov Kuroda Speech
2016-09-29 Japan Retail Sales MoM
2016-09-29 Japan Foreign Bond Investment
2016-09-29 Japan Stock Investment by Foreigners
2016-09-29 Japan Stock Investment by Foreigners
2016-09-29 Russia MNI Business Sentiment Indicator
2016-09-29 Russia GDP YoY
2016-09-29 Turkey Economic Confidence Index
2016-09-29 Turkey Tourist Arrivals YoY
2016-09-29 South Africa PPI MoM
2016-09-29 South Africa PPI YoY
2016-09-29 US Fed Mester Speech
2016-09-29 US Fed George Speech
2016-09-29 US Fed Harker Speech
2016-09-29 US GDP Growth Rate QoQ Final
2016-09-29 US Core PCE Prices QoQ Final
2016-09-29 US PCE Prices QoQ Final
2016-09-29 US GDP Price Index QoQ Final
2016-09-29 US Corporate Profits QoQ Final
2016-09-29 US Initial Jobless Claims
2016-09-29 US Continuing Jobless Claims
2016-09-29 US Fed Lockhart Speech
2016-09-29 US Fed Powell Speech
2016-09-29 US Pending Home Sales YoY
2016-09-29 US Pending Home Sales MoM
2016-09-29 US EIA Natural Gas Stocks Change
Results
Our Recent Research Reports
Select Equity Data Snapshot
Most Profitable Cos
| value | Stock | Origin | NetMargin |
| Scentre Group | SCG:AU | Australia | 94.37 |
| Assore Ltd | ASR:SJ | South Africa | 77.37 |
| Surgutneftegas OJSC | SNGSP:RM | Russia | 76.24 |
| Surgutneftegas OJSC | SNGS:RM | Russia | 75.48 |
| Redefine Properties Ltd | RDF:SJ | South Africa | 67.98 |
| Sihuan Pharmaceutical Holdings Group Ltd | 460:HK | China | 65.03 |
| Moscow Exchange MICEX-RTS PJSC | MOEX:RM | Russia | 60.13 |
| Transmissora Alianca de Energia Eletrica SA | TAEE11:BZ | Brazil | 60.00 |
| Emlak Konut Gayrimenkul Yatirim Ortakligi AS | EKGYO:TI | Turkey | 59.70 |
| ASX Ltd | ASX:AU | Australia | 56.51 |
| SOHO China Ltd | 410:HK | China | 54.34 |
| Koza Altin Isletmeleri AS | KOZAL:TI | Turkey | 53.70 |
| Mirvac Group | MGR:AU | Australia | 53.59 |
| Stockland | SGP:AU | Australia | 52.09 |
| Growthpoint Properties Ltd | GRT:SJ | South Africa | 42.13 |
| Adani Ports & Special Economic Zone Ltd | ADSEZ:IN | India | 40.48 |
| CETIP SA - Mercados Organizados | CTIP3:BZ | Brazil | 38.01 |
| Eneva SA | ENEV3:BZ | Brazil | 34.29 |
| Multiplan Empreendimentos Imobiliarios SA | MULT3:BZ | Brazil | 33.63 |
| Kroton Educacional SA | KROT3:BZ | Brazil | 30.92 |
Select FI Data Snapshot