Indexes
Currencies
Commodities
Rates
Index Performance
Changes between 2016-09-29 and 2016-09-26
| Ndex | Last | WkChPct | |
| Borsa Istanbul 100 Index | 77335.9 | -3.03 | |
| S&P BSE SENSEX Index | 27857.84 | -2.83 | |
| Deutsche Boerse AG German Stoc | 10438.34 | -2.21 | |
| Nikkei 225 | 16465.4 | -2.04 | |
| Shanghai Stock Exchange Compos | 2987.858 | -1.79 | |
| FTSE 100 Index | 6849.38 | -0.90 | |
| Warsaw Stock Exchange WIG Tota | 47509.62 | -0.74 | |
| Hong Kong Hang Seng Index | 23619.65 | -0.59 | |
| S&P/TSX Composite Index | 14731.43 | -0.44 | |
| MICEX Index | 2003.37 | -0.42 | |
| Dow Jones Industrial Average | 18339.24 | -0.29 | |
| S&P 500 Index | 2159.93 | -0.15 | |
| Mexican Stock Exchange Mexican | 48046.56 | 0.15 | |
| Russian Trading System Cash In | 997.39 | 0.35 | |
| Ibovespa Brasil Sao Paulo Stoc | 59355.77 | 0.61 | |
| Korea Stock Exchange KOSPI Ind | 2068.72 | 0.71 | |
| Russian Depositary Index USD | 1176.69 | 0.92 | |
| FTSE/JSE Africa All Share Inde | 52540.32 | 1.04 | |
| Jakarta Stock Exchange Composi | 5447.017 | 1.08 | |
| Karachi Stock Exchange KSE100 | 40401.94 | 1.56 |
Weekly Currency Performance
| Currency | Last | WkChPct | |
| AZN | 1.625 | -1.49 | |
| KZT | 334.93 | -0.88 | |
| NOK | 8.0535 | -0.73 | |
| AUD | 1.3033 | -0.62 | |
| CAD | 1.31 | -0.55 | |
| KRW | 1098.81 | -0.33 | |
| ZAR | 13.6958 | -0.16 | |
| BRL | 3.2167 | -0.12 | |
| PKR | 104.655 | -0.11 | |
| EUR | 0.8915 | -0.08 | |
| JPY | 100.69 | -0.07 | |
| LVL | 0.62655 | 0.07 | |
| CNY | 6.6751 | 0.15 | |
| INR | 66.865 | 0.32 | |
| RUB | 63.9936 | 0.56 | |
| TRY | 2.9996 | 1.03 |
Weekly Commodities Performance
| name | last | WeekCh | |
| COCOA (ICE) | 2825.0 | -3.25 | |
| LIVE CATTLE (CME) | 103.625 | -3.11 | |
| SILVER (COMEX) | 19.2 | -3.08 | |
| PLATINUM SPOT | 1028.79 | -2.39 | |
| COTTON #2 (ICE) | 68.67 | -2.00 | |
| GOLD (COMEX) | 1325.0 | -1.24 | |
| GOLD SPOT | 1321.94 | -1.17 | |
| COPPER (COMEX) | 218.45 | -0.75 | |
| NATURAL GAS (NYMEX) | 3.016 | 2.06 | |
| BRENT CRUDE (ICE) | 48.08 | 4.77 | |
| HEATING OIL (NYMEX) | 147.52 | 4.82 | |
| WTI CRUDE OIL (NYMEX) | 46.71 | 5.01 | |
| RBOB GASOLINE (NYMEX) | 145.4 | 5.60 |
Weekly Bond Rates Performance Change in btps
Weekly GEM Sov. Bond Rates Performance Change in btps
Data in this table is from last Thursday Fixed Income update
| Country | Average Yield | Yield Average change % pts | |
| El Salvador | 7.36 | 0.09 | |
| Ukraine | 8.27 | 0.05 | |
| Trinidad and Tobago | 4.12 | 0.05 | |
| Slovak Republic | 1.79 | 0.04 | |
| United States | 0.53 | 0.00 | |
| Lithuania | 1.98 | -0.03 | |
| Malaysia | 3.47 | -0.04 | |
| Pakistan | 5.05 | -0.04 | |
| China | 2.40 | -0.06 | |
| Poland | 2.30 | -0.08 | |
| Mexico | 4.08 | -0.10 | |
| Tunisia | 5.94 | -0.10 | |
| Uruguay | 3.87 | -0.10 | |
| India | 3.26 | -0.12 | |
| Chile | 2.87 | -0.13 | |
| Oman | 4.00 | -0.16 | |
| Philippines | 2.51 | -0.16 | |
| Russian Federation | 3.83 | -0.17 | |
| Paraguay | 5.22 | -0.17 | |
| Morocco | 3.10 | -0.17 | |
| Romania | 2.98 | -0.18 | |
| Cote D'Ivoire (Ivory Coast) | 5.71 | -0.19 | |
| Costa Rica | 5.88 | -0.20 | |
| Lebanon | 6.51 | -0.20 | |
| Croatia (Hrvatska) | 3.38 | -0.21 | |
| Vietnam | 3.88 | -0.22 | |
| Kazakhstan | 4.32 | -0.22 | |
| Serbia | 3.26 | -0.22 | |
| Jamaica | 5.63 | -0.23 | |
| Indonesia | 3.67 | -0.23 | |
| Panama | 2.82 | -0.24 | |
| Dominican Republic | 5.01 | -0.25 | |
| Peru | 3.29 | -0.27 | |
| Azerbaijan | 4.78 | -0.29 | |
| Iraq | 9.02 | -0.29 | |
| Brazil | 4.53 | -0.30 | |
| Turkey | 4.39 | -0.30 | |
| Egypt | 5.63 | -0.30 | |
| Hungary | 2.92 | -0.31 | |
| Colombia | 3.57 | -0.31 | |
| South Africa | 4.20 | -0.41 | |
| Argentina | 5.82 | -0.42 | |
| Sri Lanka | 5.17 | -0.45 | |
| Kenya | 6.83 | -0.47 | |
| Ethiopia | 6.62 | -0.49 | |
| Ecuador | 9.81 | -0.49 | |
| Zambia | 8.54 | -0.63 | |
| Angola | 9.13 | -0.64 | |
| Gabon | 7.61 | -0.70 | |
| Ghana | 8.95 | -0.71 | |
| Mongolia | 7.69 | -0.79 | |
| Venezuela | 23.52 | -1.71 |
Chart: Harvesting Year for Assets - where to from here?
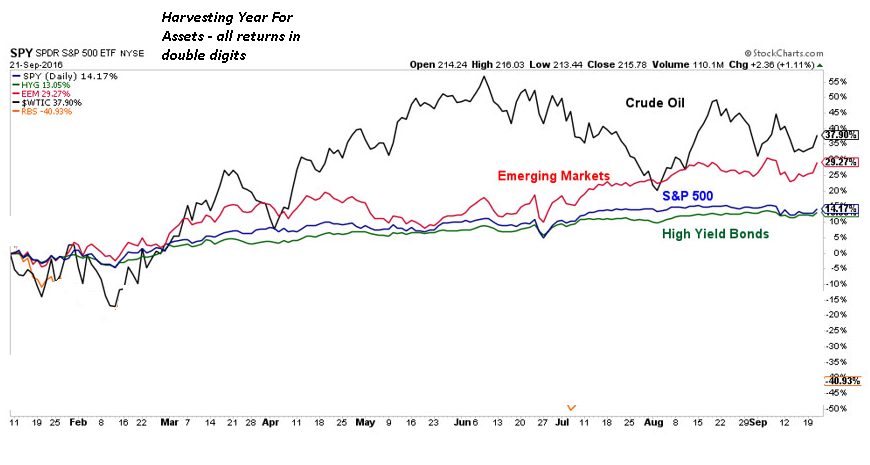
Source: RBS, MarketWatch
Market Comment Political & Economic News Today's Economic Events Today's Stock Results Recent ML Reports
Key Comment
Best since the start of the week among various stock markets was Karachi Stock Exchange KSE100 Index +1.56%, Jakarta Stock Exchange Composite Index +1.08%, FTSE/JSE Africa All Share Index +1.04%, Russian Depositary Index USD +0.92%,
While worst since the start of the week among various stock markets was Borsa Istanbul 100 Index -3.03%, S&P BSE SENSEX Index -2.83%, Deutsche Boerse AG German Stock Index DAX -2.21%, Nikkei 225 -2.04%,
Best week to date in FX space vs. greenback was TRY +1.03%, RUB +0.56%, INR +0.32%,
While worst week to date in FX space vs. greenback was AZN -1.49%, KZT -0.88%, NOK -0.73%,
Best among commodities versus last Friday close was RBOB GASOLINE (NYMEX) +5.60%, WTI CRUDE OIL (NYMEX) +5.01%, HEATING OIL (NYMEX) +4.82%,
While worst among commodities versus last Friday close was COCOA (ICE) -3.25%, LIVE CATTLE (CME) -3.11%, SILVER (COMEX) -3.08%,
News
Turkey
Brazil
Russia
China
South Africa
Australia
Korea
India
Canada
Econ Events Today
2016-09-29 Japan Foreign Bond Investment
2016-09-29 EU Economic Sentiment
2016-09-29 EU Consumer Confidence Final
2016-09-29 EU Business Confidence
2016-09-29 EU Industrial Sentiment
2016-09-29 EU Services Sentiment
2016-09-29 EU ECB Praet Speech
2016-09-29 EU ECB Const?ncio Speech
2016-09-29 Japan Retail Sales YoY
2016-09-29 Japan BoJ Gov Kuroda Speech
2016-09-29 Japan Retail Sales MoM
2016-09-29 Japan Foreign Bond Investment
2016-09-29 Japan Stock Investment by Foreigners
2016-09-29 Japan Stock Investment by Foreigners
2016-09-29 Russia MNI Business Sentiment Indicator
2016-09-29 Russia GDP YoY
2016-09-29 Turkey Economic Confidence Index
2016-09-29 Turkey Tourist Arrivals YoY
2016-09-29 South Africa PPI MoM
2016-09-29 South Africa PPI YoY
2016-09-29 US Fed Mester Speech
2016-09-29 US Fed George Speech
2016-09-29 US Fed Harker Speech
2016-09-29 US GDP Growth Rate QoQ Final
2016-09-29 US Core PCE Prices QoQ Final
2016-09-29 US PCE Prices QoQ Final
2016-09-29 US GDP Price Index QoQ Final
2016-09-29 US Corporate Profits QoQ Final
2016-09-29 US Initial Jobless Claims
2016-09-29 US Continuing Jobless Claims
2016-09-29 US Fed Lockhart Speech
2016-09-29 US Fed Powell Speech
2016-09-29 US Pending Home Sales YoY
2016-09-29 US Pending Home Sales MoM
2016-09-29 US EIA Natural Gas Stocks Change
Econ Events Yesterday
2016-09-28 EU ECB Draghi Speech
2016-09-28 EU ECB Annual Research Conference
2016-09-28 EU ECB Draghi Speech
2016-09-28 China Westpac MNI Consumer Sentiment Indicator
2016-09-28 BRazil Bank Lending MoM
2016-09-28 Australia RBA Edey Speech
2016-09-28 US MBA Mortgage Applications
2016-09-28 US MBA 30-Year Mortgage Rate
2016-09-28 US Durable Goods Orders ex Tansp MoM
2016-09-28 US Durable Goods Orders MoM
2016-09-28 US Durable Goods Orders Ex Defense MoMAUG
2016-09-28 US Fed Kashkari Speech
2016-09-28 US Fed Yellen Testimony
2016-09-28 US Fed Bullard Speech
2016-09-28 US EIA Gasoline Stocks Change
2016-09-28 US EIA Crude Oil Stocks Change
2016-09-28 US 7-Year Note Auction
2016-09-28 US Fed Evans Speech
Results
Our Recent Research Reports
Select Equity Data Snapshot
Highest 30 MarketCaps among Crabsticks
| value | Origin | MCapUSDmn |
| Industrial & Commercial Bank of China Ltd | China | 230978.4 |
| Tencent Holdings Ltd | China | 213835.5 |
| PetroChina Co Ltd | China | 189861.2 |
| Samsung Electronics Co Ltd | Korea | 179346.0 |
| China Construction Bank Corp | China | 164340.1 |
| Agricultural Bank of China Ltd | China | 146939.4 |
| Bank of China Ltd | China | 135081.1 |
| Commonwealth Bank of Australia | Australia | 93452.6 |
| Ambev SA | Brazil | 89783.2 |
| Royal Bank of Canada | Canada | 88096.9 |
| China Petroleum & Chemical Corp | China | 86609.2 |
| Ping An Insurance Group Co of China Ltd | China | 83944.9 |
| China Life Insurance Co Ltd | China | 81259.2 |
| Toronto-Dominion Bank/The | Canada | 78412.4 |
| BHP Billiton Ltd | Australia | 72459.8 |
| Westpac Banking Corp | Australia | 71470.0 |
| China Merchants Bank Co Ltd | China | 63522.2 |
| Naspers Ltd | South Africa | 63485.0 |
| Bank of Nova Scotia/The | Canada | 58697.8 |
| Rio Tinto Ltd | Australia | 57754.4 |
| Bank of Communications Co Ltd | China | 55826.3 |
| CNOOC Ltd | China | 55246.1 |
| Rosneft PJSC | Russia | 54921.9 |
| Gazprom PJSC | Russia | 51679.3 |
| Itau Unibanco Holding SA | Brazil | 51608.7 |
| Telstra Corp Ltd | Australia | 50901.8 |
| Australia & New Zealand Banking Group Ltd | Australia | 50732.0 |
| National Australia Bank Ltd | Australia | 48881.0 |
| Suncor Energy Inc | Canada | 46772.4 |
| China Minsheng Banking Corp Ltd | China | 46039.7 |
Select FI Data Snapshot