ML Agribusiness
By: Research Team

Description
Covering Global Agribusiness
Comment
Best last week among stocks was +11.87%, +4.29%, +4.00%,
While worst last week among stocks was -5.68%, -3.57%, -1.93%,
Best last month among stocks was +7.01%, +5.63%, +2.77%,
While worst last month among stocks was -11.71%, -11.07%, -9.69%,
Best YTD among stocks was +54.86%, +44.88%, +39.04%,
While worst YTD among stocks was -41.08%, -27.88%, -27.29%,
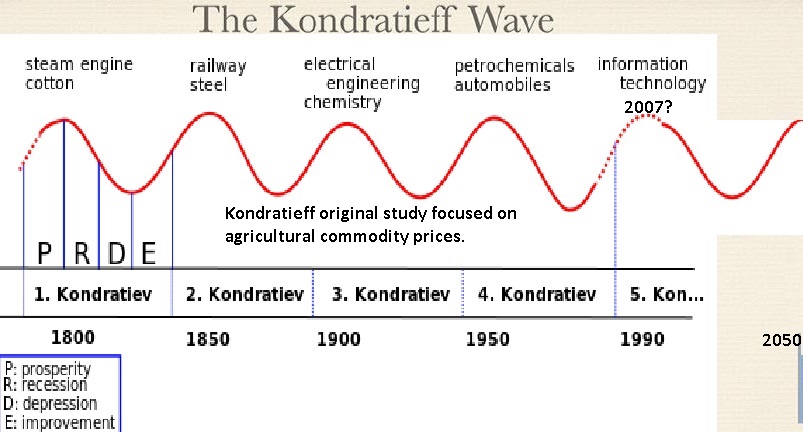
Chart: Kondratieff original stydy focuse on agri and other commodities
Source:
Chart: In 2013, the U.S. food and beverage manufacturing sector employed about 1.5 million people, or just over 1 percent of all U.S.
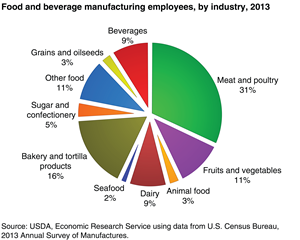
Source: USDA
Chart: In 2014, 17.3 million full- and part-time jobs were related to agriculture�about 9.3 percent of total U.S. employment.
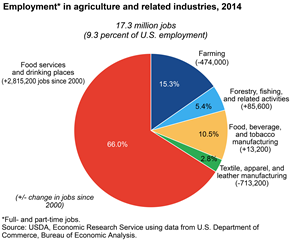
Source: USDA
Chart: Households spend 12.6-percent on food ranked third behind housing (33.3 percent) and transportation (17%)
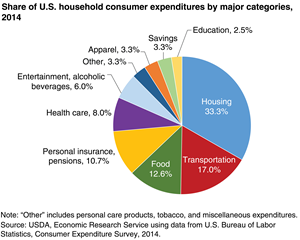
Source: USDA
Chart: Agriculture and agriculture-related industries contributed $835 billion to the U.S. gross domestic product (GDP) in 2014
a 4.8-percent share
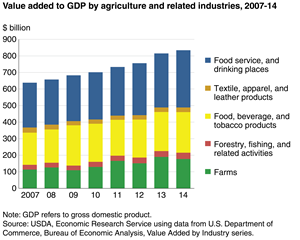
Source: USDA
Chart: More Crops are Used for Animal Feeds
Source: WorldBank
Chart: Ferts Consumption Made a Big Jump

Source: WorldBank
Chart: Despite That Land under Cereals Has been Flat for A while
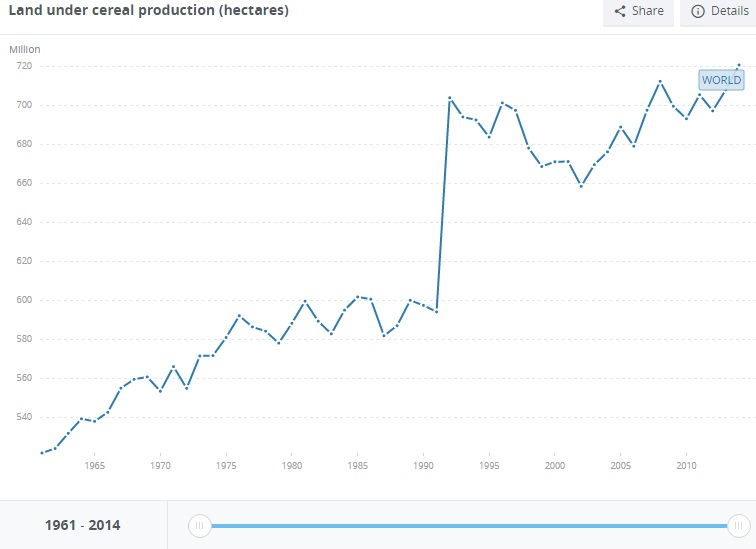
Source: WorldBank
Chart: To Produce More Food
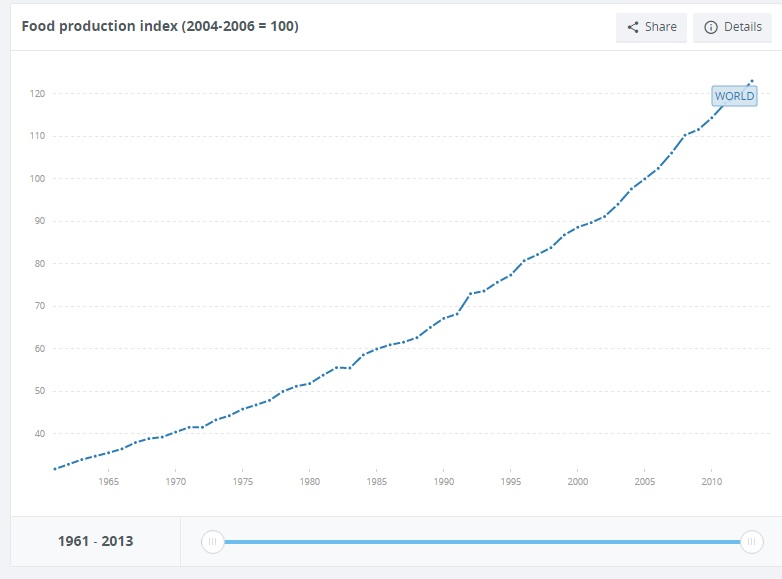
Source: WorldBank
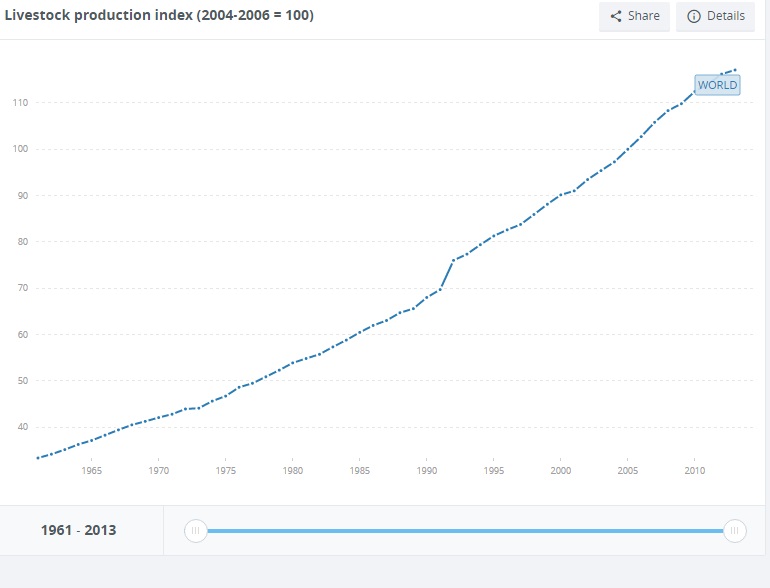
Chart: And Crops are Rising
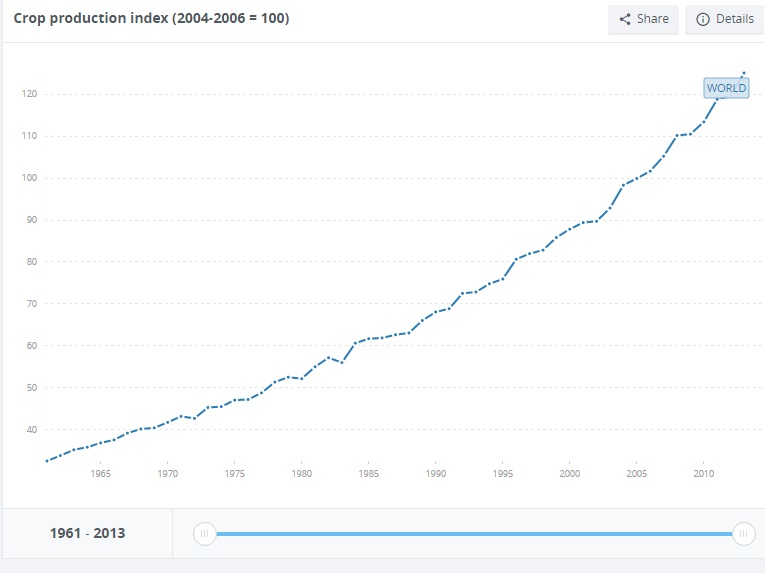
Source: WorldBank
Chart: Cereal Yields are on the Rise
As productivity improves
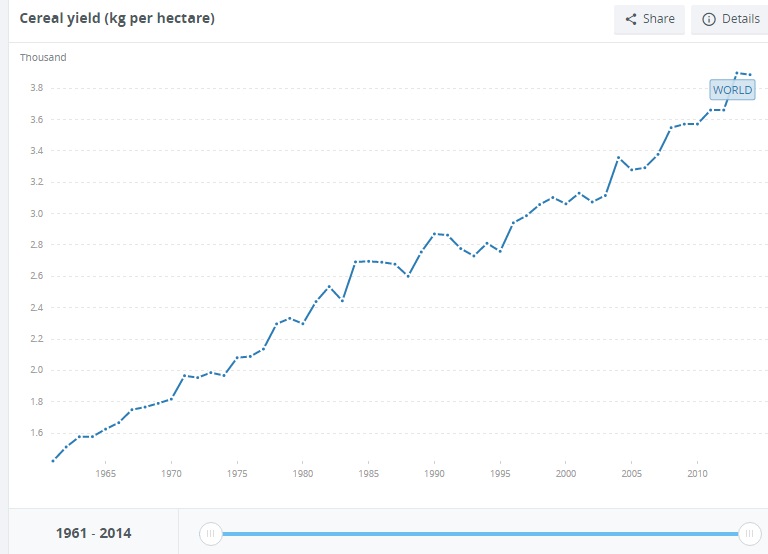
Source: WorldBank
Chart: But Arable Land Per Capital of Global Population is Rapidly Declining
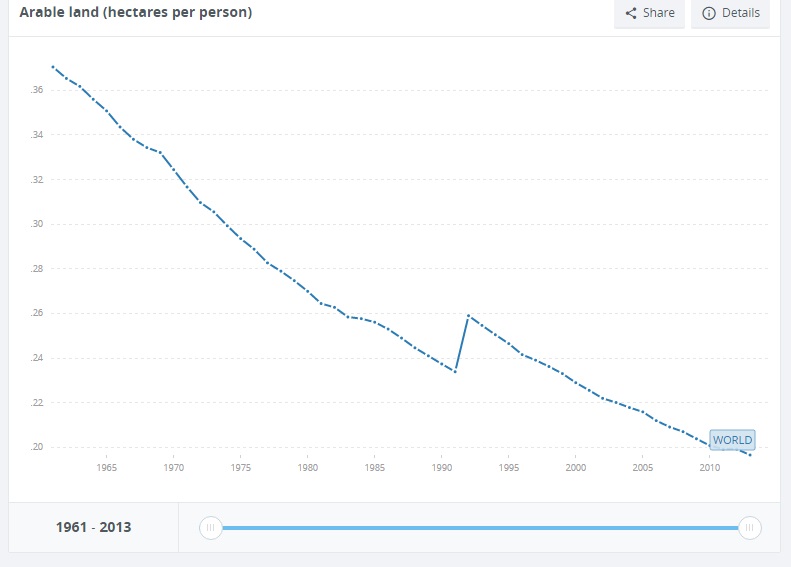
Source: WorldBank
Chart: Arable Land % of Total Has Been Stable for a While

Source: WorldBank
Agriculture Finance
EDITORIAL: Finance agriculture to develop AfricaCNFA/LADA Launch Digital Financial Services Platform in Nimba ...Sierra Leone: Le210 Billion EU Boost to Agriculture and Food SecurityAgriculture Secretary Vilsack Announces USDA Funding for Ohio ...Zimbabwe: Informal Markets Influence Supply Chain Management
Agricultural Land Prices
Gov't to Ease Development Ban on Agricultural Land to Boost Rice ...Are tax breaks for hobby farmers driving up the price of agricultural ...Farmland: A Macro PerspectiveSome Senators Cite Government Regulations as Concern for AgAre farms the new tennis courts? Olivette opts for agrihood
Agricultural Commodities
House Passes Bill to Set Up Agricultural Commodities Regulatory ...Sebi fixes price circuits for non-agricultural commoditiesContractors offer $700 mln financing for Venezuela drilling deals ...To fight hunger, Somali farmers turn to Ugandan rootsLibyan oil port takeover gives edge to eastern commander
Fertilizers
Brandt Specialty Fertilizers help grower set new world record for yieldsPacific Coast Fertilizer Announces Interest In Longview, WA FacilityBrazil's Vale shares jump on talk of fertilizer unit saleCheck temps before applying ammonium-based fertilizersRetail Fertilizer Prices Continue to Move Lower
Productivity in Agriculture
TBS urges farmers to stick to qualityPunjab govt to focus on productivity of agriculture: CSPunjab to focus on enhancing productivity of agricultureAgriculture gets a financial beatingModel to raise agricultural productivity to be announcedCountry Composition
Loading graph...
/Sector Composition
Loading graph...
Key Basket Multiples