ML Agribusiness
By: Research Team

Description
Covering Global Agribusiness
Comment
Best last week among stocks was CF Industries Holdings Inc (CF:US) +9.59%, Felda Global Ventures Holdings Bhd (FGV:MK) +7.07%, Astra Agro Lestari Tbk PT (AALI:IJ) +5.29%,
While worst last week among stocks was Kernel Holding SA (0KE:GR) -6.20%, MHP SA (MHPC:LI) -2.08%, FMC Corp (FMC:US) -1.84%,
Best last month among stocks was Felda Global Ventures Holdings Bhd (FGV:MK) +30.53%, Astra Agro Lestari Tbk PT (AALI:IJ) +11.73%, China BlueChemical Ltd (3983:HK) +9.80%,
While worst last month among stocks was CF Industries Holdings Inc (CF:US) -13.85%, Deere & Co (DE:US) -7.17%, Potash Corp of Saskatchewan Inc (POT:CN) -5.81%,
Best YTD among stocks was Charoen Pokphand Indonesia Tbk PT (CPIN:IJ) +56.34%, Tyson Foods Inc (TSN:US) +40.11%, Sociedad Quimica y Minera de Chile SA (SQM/B:CI) +32.17%,
While worst YTD among stocks was CF Industries Holdings Inc (CF:US) -40.88%, Incitec Pivot Ltd (IPL:AU) -22.91%, Associated British Foods PLC (ABF:LN) -21.02%,
Chart: Kondratieff original stydy focuse on agri and other commodities
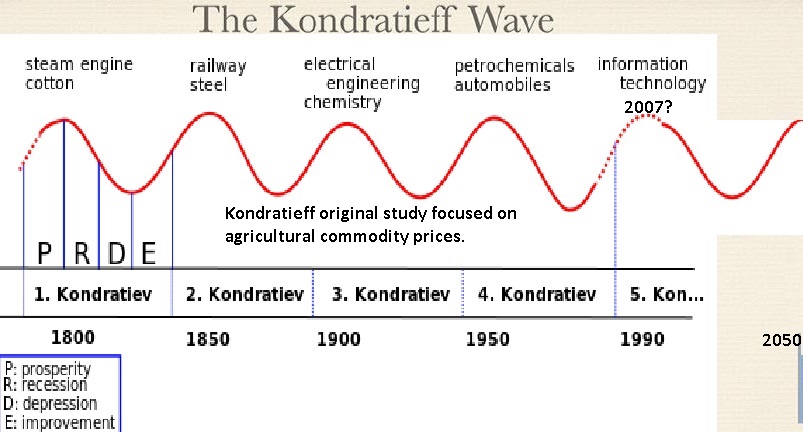
Source:
Chart: In 2013, the U.S. food and beverage manufacturing sector employed about 1.5 million people, or just over 1 percent of all U.S.
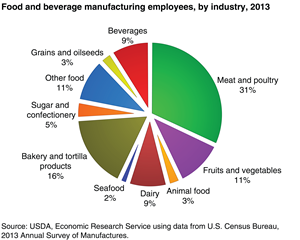
Source: USDA
Chart: In 2014, 17.3 million full- and part-time jobs were related to agriculture�about 9.3 percent of total U.S. employment.
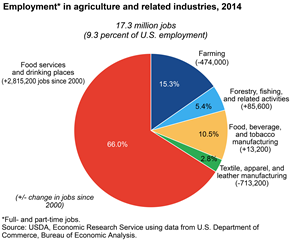
Source: USDA
Chart: Households spend 12.6-percent on food ranked third behind housing (33.3 percent) and transportation (17%)
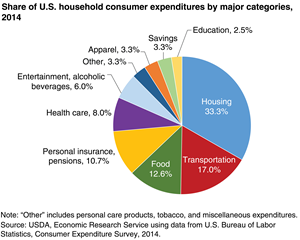
Source: USDA
Chart: Agriculture and agriculture-related industries contributed $835 billion to the U.S. gross domestic product (GDP) in 2014
a 4.8-percent share
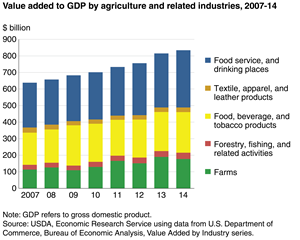
Source: USDA
Chart: More Crops are Used for Animal Feeds
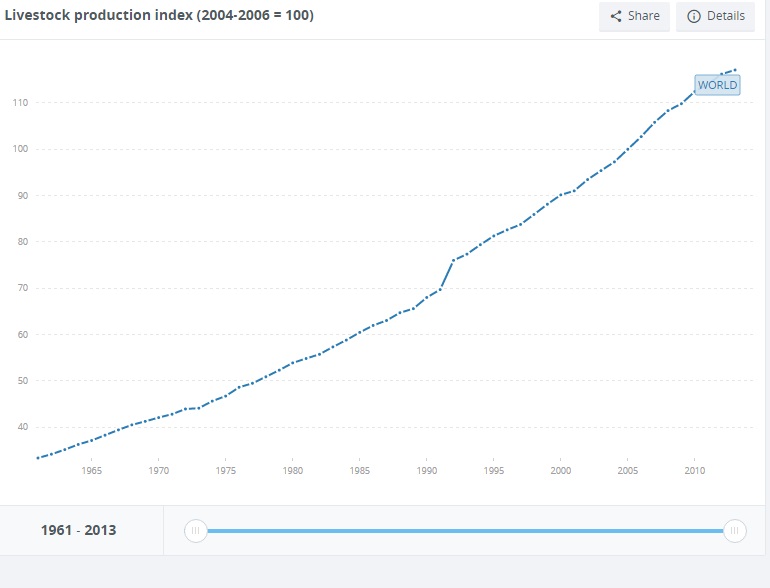
Source: WorldBank
Chart: Ferts Consumption Made a Big Jump

Source: WorldBank
Chart: Despite That Land under Cereals Has been Flat for A while
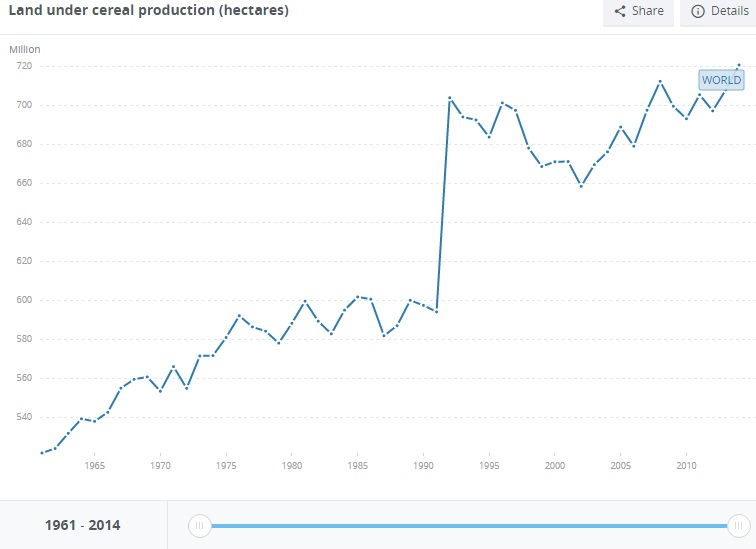
Source: WorldBank
Chart: To Produce More Food
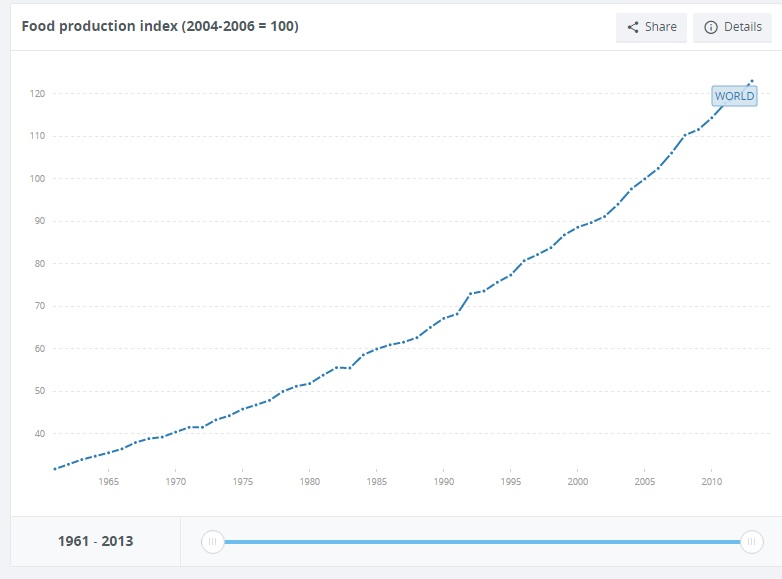
Source: WorldBank
Chart: And Crops are Rising
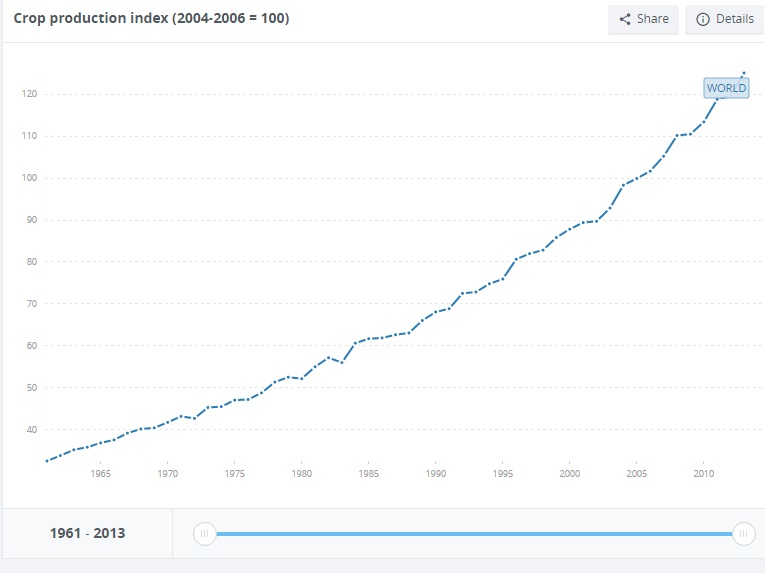
Source: WorldBank
Chart: Cereal Yields are on the Rise
As productivity improves
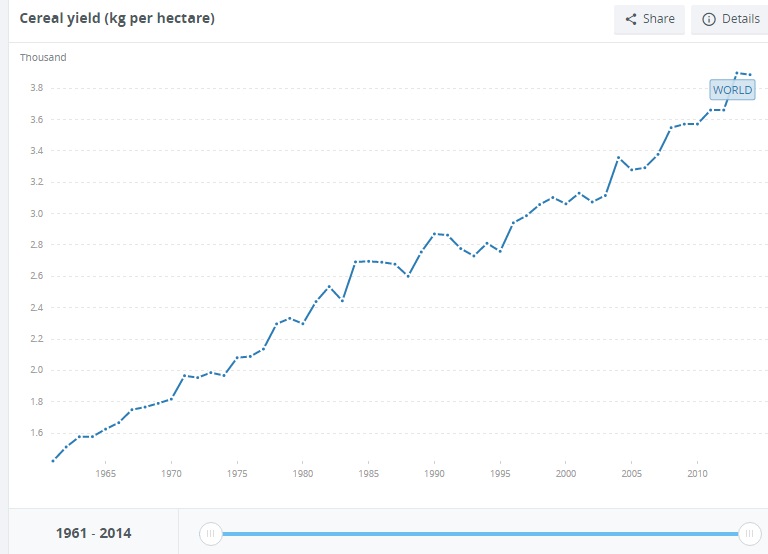
Source: WorldBank
Chart: But Arable Land Per Capital of Global Population is Rapidly Declining
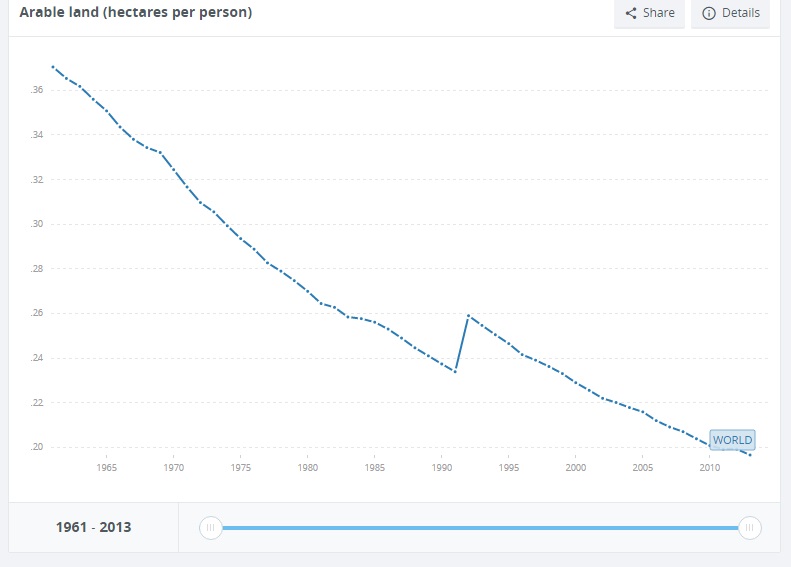
Source: WorldBank
Chart: Arable Land % of Total Has Been Stable for a While

Source: WorldBank
Agriculture Finance
Africa: Agriculture Sector Players Commit to Increase Agriculture ...Rwanda: BDF, 450 Microfinance Institutions Partner to Ease ...Islamic finance termed key to agriculture developmentBRD to extend Rwf 80 billion to agriculture financingIslamic finance ideal for agricultural, micro and rural financing
Agricultural Land Prices
Virginia Beach is placing a cap on the value of agricultural landFarmland Prices Fall in Central USCrop, pasture land prices increase in Northwest, CaliforniaLow Commodity Prices Pushing Down Farmland ValuesFarmland Prices Fall Amid Post-Brexit Unease
Agricultural Commodities
CHART: Here's a snapshot of the outlook for Australia's key ...Agricultural commodities – time to start paying attention?Chicago agricultural commodities closed mixedKenyan shilling edges up against the dollarSOFTS-Coffee, sugar prices regain ground as dollar weakens
Fertilizers
Three Fertilizers See Large Price DeclinesRussia's Fertilizer Tycoon Says Potash Glut May Last a DecadePrices of fertilizers reducedNew Summers Applicator Applies 3 Fertilizers at 8 MPHLog InRegister
Productivity in Agriculture
Productivity Commission attacks competition 'effects test' and farm ...Water, Water (Not) Everywhere: the Imperative of Increasing Water ...Agriculture Ministry Introduces Drones to FarmersEmployee assistance programs reduce workplace stress and ...Sustainability at the core of Dow's Rio 2016 effortsCountry Composition
| Country | Weight % |
| United States
| 28.13 |
| Malaysia
| 12.50 |
| Indonesia
| 6.25 |
| Russian Federation
| 6.25 |
| Ukraine
| 6.25 |
| United Kingdom
| 6.25 |
| Canada
| 6.25 |
| Chile
| 3.13 |
| Taiwan
| 3.13 |
| Switzerland
| 3.13 |
| France
| 3.13 |
| Singapore
| 3.13 |
| Hong Kong (SAR)
| 3.13 |
| Norway
| 3.13 |
| China
| 3.13 |
| Australia
| 3.13 |
Loading graph...
/Sector Composition
| Country | Weight % |
| United States
| 28.13 |
| Malaysia
| 12.50 |
| Indonesia
| 6.25 |
| Russian Federation
| 6.25 |
| Ukraine
| 6.25 |
| United Kingdom
| 6.25 |
| Canada
| 6.25 |
| Chile
| 3.13 |
| Taiwan
| 3.13 |
| Switzerland
| 3.13 |
| France
| 3.13 |
| Singapore
| 3.13 |
| Hong Kong (SAR)
| 3.13 |
| Norway
| 3.13 |
| China
| 3.13 |
| Australia
| 3.13 |
Loading graph...
Key Basket Multiples
| Stocks | Total MCap US mn | Payout Ratio | Div Yield | PE | NetMargin | 1yr Return |
| 32 | 323899.3 | 43.5 | 2.6 | 21.66 | 8.41 | 4.3 |
Results
2015-11-03 Archer-Daniels-Midland Co
Cons
Archer Daniels Midland Co. (ADM) Posts Quarterly Earnings Results ...Market Review: Narrowing in on Shares of Archer-Daniels-Midland ...
2015-11-23 Tyson Foods Inc
Cons
Tyson Foods (TSN) Donald J. Smith on Q3 2016 Results - Earnings ...Tyson Foods 3Q Net Income Up 41 Percent
2015-11-25 Deere & Co
industr
Buffett, Gates trim Deere holdings, planting seeds of doubt ahead of ...Deere & Company Net Income Is Trending Lower
2015-11-03 Mosaic Co/The
mater
Revenue Update on Mosaic Co(NYSE:MOS)Warburg Pincus to Invest $255 Million in BlueGrace Logistics
2015-11-05 CF Industries Holdings Inc
mater
CF Industries Holdings (CF) W. Anthony Will on Q2 2016 Results ...CF Industries Holdings, Inc. (NYSE:CF) Insider Activities Are in the Air
| value | stock | Country | Industry | MCap US mn | DividendYield | PE | PS | NetMarginPct | PayoutRatio | 52wkchange | Score |
| Incitec Pivot Ltd | IPL:AU | Australia
| Agricultural Chemicals | 3709.88 | 5.32% | 16.86 | 1.34 | 7.95 | 89.70 | -15.82 | 58.02 |
| Agrium Inc | AGU:CN | Canada
| Agricultural Chemicals | 12569.67 | 3.85% | 14.17 | 0.90 | 6.35 | 54.55 | -12.90 | 26.89 |
| Potash Corp of Saskatchewan Inc | POT:CN | Canada
| Agricultural Chemicals | 13458.75 | 6.35% | 17.44 | 2.62 | 15.02 | 110.74 | -37.13 | 64.25 |
| Sociedad Quimica y Minera de Chile SA | SQM/B:CI | Chile
| Agricultural Chemicals | 6966.29 | 0.71% | 32.41 | 3.76 | 11.60 | 23.01 | 79.04 | 74.30 |
| China BlueChemical Ltd | 3983:HK | China
| Agricultural Chemicals | 998.80 | 5.63% | 7.96 | 0.62 | 7.79 | 44.81 | -28.31 | 9.39 |
| Eridania Beghin-Say | BG:LN | France
| Agricultural Producers | 0.00 | - | - | - | 0.00 | 0.00 | 0.02 | -6.93 |
| China Agri-Industries Holdings Ltd | 606:HK | Hong Kong (SAR)
| Agricultural Producers | 1997.21 | - | - | 0.19 | 0.00 | 0.00 | -19.18 | -26.12 |
| Charoen Pokphand Indonesia Tbk PT | CPIN:IJ | Indonesia
| Agricultural Producers | 4838.73 | 0.75% | 24.51 | 1.87 | 7.63 | 18.38 | 109.15 | 103.71 |
| Astra Agro Lestari Tbk PT | AALI:IJ | Indonesia
| Agricultural Producers | 2436.14 | - | 28.32 | 2.25 | 7.94 | -0.00 | -3.61 | -30.93 |
| Felda Global Ventures Holdings Bhd | FGV:MK | Malaysia
| Agricultural Producers | 2028.55 | 1.80% | - | 0.48 | 0.00 | -0.00 | 60.54 | 53.60 |
| Genting Plantations Bhd | GENP:MK | Malaysia
| Agricultural Producers | 2097.68 | 0.57% | 49.93 | 6.25 | 12.52 | 28.46 | 16.89 | 1.00 |
| IOI Corp Bhd | IOI:MK | Malaysia
| Agricultural Producers | 6929.99 | 1.82% | 30.28 | 2.34 | 7.73 | 55.11 | 13.84 | 39.45 |
| PPB Group Bhd | PEP:MK | Malaysia
| Agricultural Producers | 4798.50 | 1.55% | 17.99 | 4.57 | 25.40 | 27.88 | 9.72 | 38.07 |
| Yara International ASA | YAR:NO | Norway
| Agricultural Chemicals | 9580.46 | 5.23% | 7.62 | 0.77 | 10.10 | 39.85 | -22.16 | 13.23 |
| Ros Agro PLC | AGRO:LI | Russian Federation
| Agricultural Products Whslrs | 2029.00 | 7.81% | 4.74 | 1.49 | 31.43 | 37.02 | 91.19 | 147.96 |
| Uralkali PJSC | URKA:RM | Russian Federation
| Agricultural Chemicals | 8665.44 | - | 118.74 | 2.04 | 1.72 | -0.00 | -2.39 | -126.36 |
| Golden Agri-Resources Ltd | E5H:LI | Singapore
| Agricultural Producers | 0.00 | - | - | - | 0.00 | 0.00 | 0.04 | -6.90 |
| Syngenta AG | SYNN:VX | Switzerland
| Agricultural Chemicals | 36861.13 | 2.88% | 31.09 | 2.86 | 9.20 | 89.54 | 0.42 | 61.12 |
| Taiwan Fertilizer Co Ltd | 1722:TT | Taiwan
| Agricultural Chemicals | 1341.89 | 4.88% | 16.37 | 2.71 | 16.55 | 79.89 | 2.99 | 76.12 |
| Kernel Holding SA | 0KE:GR | Ukraine
| Agricultural Producers | 1167.82 | 1.69% | - | - | 0.00 | -0.00 | 29.81 | 22.86 |
| MHP SA | MHPC:LI | Ukraine
| Agricultural Producers | 994.33 | 8.00% | 40.29 | 0.86 | 2.13 | 322.32 | 9.65 | 286.87 |
| Associated British Foods PLC | ABF:LN | United Kingdom
| Packaged Food | 30952.94 | 1.18% | 31.64 | 1.86 | 5.88 | 37.34 | -6.58 | -1.95 |
| CNH Industrial NV | CNHI:IM | United Kingdom
| Agricultural Machinery | 10310.06 | 1.92% | - | - | 0.00 | -0.00 | -10.96 | -17.91 |
| Tyson Foods Inc | TSN:US | United States
| Packaged Food | 29972.00 | 0.80% | 17.25 | 0.77 | 4.46 | 13.80 | 76.56 | 70.63 |
| Monsanto Co | MON:US | United States
| Agricultural Chemicals | 45490.00 | 2.08% | 23.63 | 3.48 | 14.73 | 49.15 | 3.36 | 36.66 |
| FMC Corp | FMC:US | United States
| Agricultural Chemicals | 6341.00 | 1.39% | 20.48 | 1.90 | 9.28 | 28.47 | 1.57 | 11.89 |
| Archer-Daniels-Midland Co | ADM:US | United States
| Agricultural Producers | 25452.00 | 2.74% | 16.12 | 0.42 | 2.61 | 44.17 | -5.63 | 18.08 |
| AGCO Corp | AGCO:US | United States
| Agricultural Machinery | 3803.00 | 1.11% | 17.47 | 0.54 | 3.09 | 19.39 | -11.14 | -13.07 |
| Deere & Co | DE:US | United States
| Agricultural Machinery | 24151.00 | 3.12% | 14.95 | 0.89 | 5.95 | 46.64 | -15.61 | 15.09 |
| Bunge Ltd | BG:US | United States
| Agricultural Products Whslrs | 8939.00 | 2.62% | 12.68 | 0.22 | 1.74 | 33.22 | -13.26 | 2.07 |
| Mosaic Co/The | MOS:US | United States
| Agricultural Chemicals | 9721.00 | 3.96% | 18.09 | 1.29 | 7.13 | 71.64 | -33.39 | 20.34 |
| CF Industries Holdings Inc | CF:US | United States
| Agricultural Chemicals | 5297.00 | 5.27% | 14.55 | 1.27 | 8.73 | 76.68 | -62.56 | 1.35 |
Index Sector Valuations vs GEM Average
| Sector | Sector MCap US mn | Sector MCap Share in Total | Gem Sector Share In Total GEM | GEM Sector MCAP USmn | Payout Ratio | GEM Payout Ratio | Div Yield | GEM Div Yield | PE | PEGEM | PE Discount vs GEM | NetMargin | NetMarginGEM | Margin Diff. vs GEM | 1yr Return | GEM 1yr Return |
| Consumer Staples | 124633.9 | 38.5 | 7.5 | 584775.3 | 30.2 | 38.0 | 1.7 | 1.8 | 22.3 | 28.2 | -20.9 | 6.0 | 10.3 | 4.3 | 22.8 | 12.3 |
| Industrials | 38264.1 | 11.8 | 5.8 | 453138.2 | 31.4 | 23.4 | 2.6 | 1.8 | 15.3 | 18.6 | -17.7 | 5.6 | 11.4 | 5.8 | -13.9 | 22.9 |
| Materials | 161001.3 | 49.7 | 7.6 | 590209.4 | 57.8 | 27.5 | 3.3 | 3.1 | 22.4 | 18.1 | 23.8 | 10.7 | 9.8 | -0.9 | -5.6 | -0.1 |
Top 5 ML Agribusiness Long Picks
| value | stock | Country | Industry | MCapUSDmn | DividendYield | PE | PS | NetMarginPct | PayoutRatio | 52wkchange | Score |
| MHP SA | MHPC:LI | Ukraine
| Agricultural Producers | 994.33 | 8.00% | 40.29 | 0.86 | 2.13 | 322.32 | 9.65 | 286.87 |
| Ros Agro PLC | AGRO:LI | Russian Federation
| Agricultural Products Whslrs | 2029.00 | 7.81% | 4.74 | 1.49 | 31.43 | 37.02 | 91.19 | 147.96 |
| Charoen Pokphand Indonesia Tbk PT | CPIN:IJ | Indonesia
| Agricultural Producers | 4838.73 | 0.75% | 24.51 | 1.87 | 7.63 | 18.38 | 109.15 | 103.71 |
| Taiwan Fertilizer Co Ltd | 1722:TT | Taiwan
| Agricultural Chemicals | 1341.89 | 4.88% | 16.37 | 2.71 | 16.55 | 79.89 | 2.99 | 76.12 |
| Sociedad Quimica y Minera de Chile SA | SQM/B:CI | Chile
| Agricultural Chemicals | 6966.29 | 0.71% | 32.41 | 3.76 | 11.60 | 23.01 | 79.04 | 74.30 |
Top 5 ML Agribusiness Short Picks
| value | stock | Country | Industry | MCapUSDmn | DividendYield | PE | PS | NetMarginPct | PayoutRatio | 52wkchange | Score |
| Uralkali PJSC | URKA:RM | Russian Federation
| Agricultural Chemicals | 8665.44 | - | 118.74 | 2.04 | 1.72 | -0.00 | -2.39 | -113.49 |
| Astra Agro Lestari Tbk PT | AALI:IJ | Indonesia
| Agricultural Producers | 2436.14 | - | 28.32 | 2.25 | 7.94 | -0.00 | -3.61 | -18.06 |
| China Agri-Industries Holdings Ltd | 606:HK | Hong Kong (SAR)
| Agricultural Producers | 1997.21 | - | - | 0.19 | 0.00 | 0.00 | -19.18 | -13.25 |
| CNH Industrial NV | CNHI:IM | United Kingdom
| Agricultural Machinery | 10310.06 | 1.92% | - | - | 0.00 | -0.00 | -10.96 | -5.04 |
| AGCO Corp | AGCO:US | United States
| Agricultural Machinery | 3803.00 | 1.11% | 17.47 | 0.54 | 3.09 | 19.39 | -11.14 | -0.20 |
xxxxxxxxxxxxxxxxxxxxxxxxxxxxxxxxxxx
xxxxxxxxxxxxxxxxxxxxxxxxxxxxxxxxxxx
Weekly Fund flow into Agri focused funds showed (Previous Week)-7.6 USD mn of outflow.
Top 10 Agri Focused Funds by Inflows Last Week
| Fund Name | fund flow mn$ | Total Assets mn$ | | MIRAE ROGERS AGRICULTURAL PRODUCT INDEX SPECIAL ASSET INVEST CMDTY-DERIVATIVE (5620974) | 0.2 | 73.1 | | POWERSHARES GLOBAL AGRICULTURE (PSUU) | 0.0 | 5.9 | | ETFS AGRICULTURE DJ-UBSCI (AIGA) | -1.6 | 230.1 |
Top 10 Agri Focused Funds by Outflow Last Week
| Fund Name | fund flow mn$ | Total Assets mn$ | | ETFS AGRICULTURE DJ-UBSCI (AIGA) | -1.6 | 230.1 | | POWERSHARES GLOBAL AGRICULTURE (PSUU) | 0.0 | 5.9 | | MIRAE ROGERS AGRICULTURAL PRODUCT INDEX SPECIAL ASSET INVEST CMDTY-DERIVATIVE (5620974) | 0.2 | 73.1 |
|
|