Midlincoln Aggregates for funds
for week ending last Friday (inclusive)
| Focus | Objective | Asset Class | Flow USD mn |
| Commodities | INDUSTRIAL METALS | Commodity | -0.12 |
| Commodities | PRECIOUS METAL SECTOR | Equity | -49.29 |
| Commodities | PRECIOUS METALS | Commodity | -255.31 |
| Commodities | PRECIOUS METALS | Mixed Allocation | 1.11 |
| country | AUSTRALIA | Equity | 34.92 |
| country | AUSTRALIA | Fixed Income | 5.24 |
| country | AUSTRALIA | Mixed Allocation | 0.28 |
| country | BRAZIL | Equity | 3.39 |
| country | BRAZIL | Fixed Income | -1402.69 |
| country | CHINA | Equity | -304.80 |
| country | CHINA | Fixed Income | 15.71 |
| country | INDIA | Equity | 184.44 |
| country | INDIA | Fixed Income | -2.75 |
| country | ISRAEL | Equity | -0.01 |
| country | JAPAN | Equity | -28347.99 |
| country | JAPAN | Fixed Income | -7.85 |
| country | KOREA | Equity | -80.69 |
| country | POLAND | Equity | 0.91 |
| country | RUSSIA | Equity | -22.85 |
| country | RUSSIA | Fixed Income | 1.75 |
| country | SOUTH AFRICA | Equity | 2.43 |
| country | SPAIN | Equity | 4.86 |
| Country | TAIWAN | Equity | 5.98 |
| country | TURKEY | Equity | 1.17 |
| country | UNITED KINGDOM | Equity | -18.47 |
| industry | BASIC MATERIALS SECTOR | Equity | 44.98 |
| industry | COMMUNICATIONS SECTOR | Equity | 46.44 |
| industry | ENERGY SECTOR | Equity | 105.71 |
| industry | FINANCIAL SECTOR | Equity | -0.18 |
| industry | HEALTH CARE SECTOR | Equity | 11.45 |
| industry | INDUSTRIAL SECTOR | Equity | 0.48 |
| industry | MULTIPLE SECTOR | Equity | 0.01 |
| industry | NATURAL RESOURCES SECTOR | Equity | -26.27 |
| industry | REAL ESTATE SECTOR | Alternative | -0.87 |
| industry | REAL ESTATE SECTOR | Equity | 78.85 |
| industry | TECHNOLOGY SECTOR | Equity | -11.71 |
| industry | UTILITIES SECTOR | Equity | 199.36 |
| region | AFRICAN REGION | Equity | 28.90 |
| region | AFRICAN REGION | Fixed Income | 5.04 |
| region | ASIAN PACIFIC REGION | Equity | 54.09 |
| region | ASIAN PACIFIC REGION | Fixed Income | -2.31 |
| region | ASIAN PACIFIC REGION EX JAPAN | Equity | 128.46 |
| region | ASIAN PACIFIC REGION EX JAPAN | Fixed Income | -28.73 |
| region | ASIAN PACIFIC REGION EX JAPAN | Mixed Allocation | 0.89 |
| region | EASTERN EUROPEAN REGION | Equity | 29.10 |
| region | EASTERN EUROPEAN REGION | Fixed Income | 0.84 |
| region | EUROPEAN REGION | Equity | -44.51 |
| region | EUROPEAN REGION | Fixed Income | 78.73 |
| region | LATIN AMERICAN REGION | Equity | 87.78 |
| region | LATIN AMERICAN REGION | Fixed Income | -173.70 |
| region | MIDDLE EAST REGION | Equity | 0.41 |
| region | MIDDLE EAST REGION | Fixed Income | 0.23 |
| region | NORDIC REGION | Equity | -1.91 |
| region | NORTH AMERICAN REGION | Equity | 198.99 |
| region | NORTH AMERICAN REGION | Fixed Income | 0.29 |
| Risk | GOVERNMENT BOND | Fixed Income | 31.55 |
| Risk | GOVERNMENT BOND | Mixed Allocation | 0.00 |
| Risk | INFLATION PROTECTED | Brazil | 0.11 |
| Risk | INFLATION PROTECTED | Fixed Income | 240.02 |
| Risk | LONG SHORT | Alternative | -155.26 |
| Risk | LONG SHORT | Equity | 541.16 |
| Risk | LONG SHORT | Fixed Income | 5.04 |
| Risk | LONG SHORT | Mixed Allocation | -0.04 |
| Sector | AGRICULTURE | Commodity | -7.64 |
| Sector | AGRICULTURE | Equity | 0.01 |
| Sector | CONSUMER DISCRETIONARY | Equity | -16.90 |
| Sector | CONSUMER STAPLES | Equity | -94.20 |
| segment | BRIC | Equity | 2.44 |
| segment | BRIC | Fixed Income | 0.21 |
| segment | DEVELOPED MARKETS | Equity | 18.06 |
| segment | EMEA | Equity | 0.20 |
| segment | EMEA | Fixed Income | 1.15 |
| segment | EMERGING MARKETS | Equity | 1072.24 |
| segment | GCC | Equity | -10.20 |
| segment | GCC | Fixed Income | 0.00 |
| segment | GCC | Mixed Allocation | -0.03 |
| segment | MENA | Equity | 0.13 |
| segment | MENA | Fixed Income | 0.36 |
| Size | LARGE-CAP | Equity | 3102.56 |
| Size | MID-CAP | Commodity | -0.07 |
| Size | MID-CAP | Equity | -371.97 |
| Size | SMALL-CAP | Equity | -159.23 |
Source: Midlincoln Research
Fund Aggregates

Chart: Utilites receive biggest inflow last week. Which supports our yesterday argument: Utilities are well known dividend plays competing with bonds. While DM utilities stocks have done excellent as hunt for the yield spilled over into equities, emerging market utilities are trading below zilch, implying that the Debt to Equity spillover is lagging in GEMs, and that's understandable, given GEM bonds yields are quite chunky especially for less risky investors. But it is likely that GEMs will follow DMs in the pattern. GEM utilities will be the first to react.
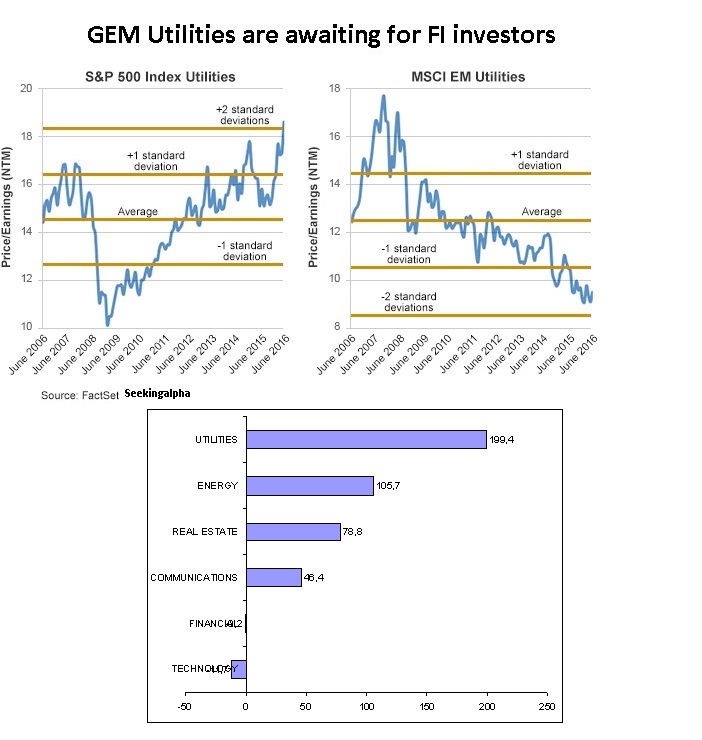
Source: ML, Seekingalpha
Emerging markets fund flow showed 1072.2 USD mn of inflow. While Frontier Markets funds showed 0.0 USD mn of inflows.
BRAZIL Equity funds showed 3.4 USD mn of inflow.
BRAZIL Fixed Income funds showed -1402.7 USD mn of outflow.
CHINA Equity funds showed -304.8 USD mn of outflow.
CHINA Fixed Income funds showed 15.7 USD mn of inflow.
INDIA Equity funds showed 184.4 USD mn of inflow.
INDIA Fixed Income funds showed -2.8 USD mn of outflow.
KOREA Equity funds showed -80.7 USD mn of outflow.
RUSSIA Equity funds showed -22.8 USD mn of outflow.
RUSSIA Fixed Income funds showed 1.8 USD mn of inflow.
SOUTH AFRICA Equity funds showed 2.4 USD mn of inflow.
TURKEY Equity funds showed 1.2 USD mn of inflow.
COMMUNICATIONS SECTOR Equity funds showed 46.4 USD mn of inflow.
ENERGY SECTOR Equity funds showed 105.7 USD mn of inflow.
FINANCIAL SECTOR Equity funds showed -0.2 USD mn of outflow.
REAL ESTATE SECTOR Alternative funds showed -0.9 USD mn of outflow.
REAL ESTATE SECTOR Equity funds showed 78.8 USD mn of inflow.
TECHNOLOGY SECTOR Equity funds showed -11.7 USD mn of outflow.
UTILITIES SECTOR Equity funds showed 199.4 USD mn of inflow.
LONG SHORT Alternative funds showed -155.3 USD mn of outflow.
LONG SHORT Equity funds showed 541.2 USD mn of inflow.
LONG SHORT Fixed Income funds showed 5.0 USD mn of inflow.
LONG SHORT Mixed Allocation funds showed 0.0 USD mn of inflow.
It is worth noting that MidLincoln data shows flow dynamics for last week ending last Friday where as EPFR data reports data only to last Wednesday, which makes ML data far more relevant
Top 5 fund winners and Top 5 losers by country by inflow
Russia Inflows
| assclass | profile | flow USD mln$ |
| Equity | HSBC Global Investment Funds - Russia Equity | 23.92 |
| Equity | HSBC Global Investment Funds - Russia Equity | 6.89 |
| Equity | HSBC Global Investment Funds - Russia Equity | 5.89 |
| Equity | HSBC MSCI Russia Capped UCITS ETF $ is a | 5.24 |
| Equity | JPMorgan Funds - Russia Fund is an open-end | 3.41 |
Russia Outflows
| assclass | profile | flow USD mln$ |
| Equity | LYXOR ETF RUSSIA (Dow Jones Russia GDR) - | -23.79 |
| Equity | Direxion Daily Russia Bull 3x Shares is an | -21.35 |
| Equity | LYXOR ETF RUSSIA Dow Jones Russia GDR - D | -20.85 |
| Equity | iShares MSCI Russi a ADR/GDR UCITS ETF | -2.09 |
| Equity | db x-trackers MSCI Russia Capped Index UCITS | -1.28 |
Source: MidLincoln Research
China Inflows
| assclass | profile | flow USD mln$ |
| Equity | Morgan Stanley China A Share Fund is a non-diversified, | 92.50 |
| Equity | W.I.S.E. - CSI 300 China Tracker� is an index-tracking | 10.05 |
| Fixed Income | Deutsche Invest I China Bonds is an open-end | 6.80 |
| Equity | First State Global Umbrella PLC - China | 3.87 |
| Fixed Income | Deutsche Invest I China Bonds is an open-end | 2.76 |
China Outflows
| assclass | profile | flow USD mln$ |
| Equity | Hang Seng Investment Index Funds Series - | -85.30 |
| Equity | iShares China Large-Cap ETF is an exchange-traded | -79.25 |
| Equity | HSBC Global Investment Funds - Chinese Equity | -49.66 |
| Equity | HSBC Global Investment Funds - Chinese | -41.60 |
| Equity | LYXOR UCITS ETF CHINA ENTERPRISE HSCEI - | -39.48 |
Source: MidLincoln Research
South Africa Inflows
| assclass | profile | flow USD mln$ |
| Equity | iShares MSCI South Africa UCITS ETF is an | 2.08 |
| Equity | NEXT FUNDS FTSE/JSE Africa Top40 Linked Exchange | 0.35 |
| Equity | NEXT FUNDS FTSE/JSE Africa Top40 Linked | 0.00 |
South Africa Outflows
| assclass | profile | flow USD mln$ |
| Equity | NEXT FUNDS FTSE/JSE Africa Top40 Linked | 0.00 |
| Equity | NEXT FUNDS FTSE/JSE Africa Top40 Linked Exchange | 0.35 |
| Equity | iShares MSCI South Africa UCITS ETF is an | 2.08 |
Source: MidLincoln Research
Korea Inflows
| assclass | profile | flow USD mln$ |
| Equity | Lyxor ETF MSCI Korea is a UCITS compliant | 9.36 |
| Equity | Korea Equity Fund, Inc. is a non-diversified, | 7.61 |
| Equity | JPMorgan Funds - Korea Equity is an open-end | 0.51 |
| Equity | WisdomTree Korea Hedged Equity Fund is an | 0.45 |
| Equity | Korea Equity Fund, Inc. is a non-diversified, | 0.01 |
Korea Outflows
| assclass | profile | flow USD mln$ |
| Equity | iShares MSCI South Korea Capped ETF is an | -89.31 |
| Equity | INVESCO Korean Equity Fund is a UCITS | -3.28 |
| Equity | INVESCO Korean Equity Fund is a UCITS certified | -3.21 |
| Equity | db x-trackers - MSCI Korea TRN Index UCITS | -2.32 |
| Equity | Deutsche X-trackers MSCI South Korea Hedged | -0.19 |
Source: MidLincoln Research
India Inflows
| assclass | profile | flow USD mln$ |
| Equity | Aberdeen Global - India Equity Fund is | 67.75 |
| Equity | Morgan Stanley India Investment Fund, Inc. | 59.26 |
| Equity | Aberdeen Global - India Equity Fund is | 47.61 |
| Equity | iShares MSCI India ETF is an exchange-traded | 24.93 |
| Equity | WisdomTree India Earnings Fund is an exchange-traded | 22.81 |
India Outflows
| assclass | profile | flow USD mln$ |
| Equity | HSBC Global Investment Funds - Indian Equity | -30.85 |
| Equity | HSBC Global Investment Funds - Indian Equity | -16.69 |
| Equity | db x-trackers CNX Nifty UCITS ETF is a UCITS | -4.70 |
| Equity | iShares India 50 ETF is an exchange-traded | -4.69 |
| Equity | AMUNDI ETF MSCI INDIA UCITS ETF is a UCITS | -4.66 |
Source: MidLincoln Research
Turkey Inflows
| assclass | profile | flow USD mln$ |
| Equity | iShares MSCI Turkey UCITS ETF is an open-end, | 1.17 |
Turkey Outflows
| assclass | profile | flow USD mln$ |
| Equity | iShares MSCI Turkey UCITS ETF is an open-end, | 1.17 |
Source: MidLincoln Research
Brazil Inflows
| assclass | profile | flow USD mln$ |
| Equity | ProShares UltraShort MSCI Brazil Capped is short | 4.70 |
| Fixed Income | DWS Brazil Bond Fund is an open-end investment | 2.19 |
| Equity | db x-trackers - MSCI Brazil TRN Index UCITS | 2.11 |
| Equity | NEXT FUNDS Ibovespa Linked Exchange Traded | 1.05 |
| Fixed Income | HSBC Global Investment Funds - Brazil Bond | 1.02 |
Brazil Outflows
| assclass | profile | flow USD mln$ |
| Fixed Income | Fondo Mutuo Security Fixed Income BRL is | -99.99 |
| Equity | Direxion Daily Brazil Bull 3x Shares is an | -2.21 |
| Equity | Lyxor ETF Brazil (Ibovespa) USD is an exchange | -2.13 |
| Fixed Income | UBS (Lux) Bond Sicav - Brazil is an open-end | -1.97 |
| Fixed Income | Aberdeen Global - Brazil Bond Fund is a | -0.81 |
Source: MidLincoln Research
Australia Inflows
| assclass | profile | flow USD mln$ |
| Equity | UBS (Lux) Equity Fund - Australia (AUD) is | 15.84 |
| Equity | iShares MSCI Australia UCITS ETF is an open-end, | 10.47 |
| Equity | Candriam Equities L - Australia is a SICAV | 8.57 |
| Fixed Income | 5.36 | |
| Equity | Candriam Equities L - Australia is a SICAV | 3.26 |
Australia Outflows
| assclass | profile | flow USD mln$ |
| Equity | Baring International Umbrella - Baring Australia | -3.37 |
| Equity | Australia Equity Income Fund is an open-end | -1.83 |
| Equity | UBS (Lux) Equity Fund - Australia (AUD) | -0.13 |
| Fixed Income | Daiwa Bond Fund Series - Monthly Dividend | -0.13 |
| Fixed Income | ZKB-CIF I Australia Govt. Bond Index is | 0.00 |
Source: MidLincoln Research
Canada Inflows
Canada Outflows
Source: MidLincoln Research
Good luck! And don’t stay out of the market for too long. As the policy of being too cautious is the greatest risk of all.
Ovanes Oganisyan