Indexes
Currencies
Commodities
Rates
Index Performance
Changes between 2016-07-18 and 2016-07-20
| Ndex | Last | WkChPct | |
| Ibovespa Brasil Sao Paulo Stoc | 56698.06 | 2.01 | |
| Jakarta Stock Exchange Composi | 5214.23 | 1.71 | |
| Warsaw Stock Exchange WIG Tota | 46251.65 | 1.56 | |
| Nikkei 225 | 16670.54 | 1.05 | |
| Mexican Stock Exchange Mexican | 47060.57 | 0.74 | |
| Hong Kong Hang Seng Index | 21841.78 | 0.47 | |
| FTSE 100 Index | 6697.37 | 0.42 | |
| S&P/TSX Composite Index | 14524.61 | 0.29 | |
| Dow Jones Industrial Average | 18559.01 | 0.23 | |
| Karachi Stock Exchange KSE100 | 39101.59 | 0.21 | |
| S&P 500 Index | 2163.78 | 0.09 | |
| FTSE/JSE Africa All Share Inde | 52892.92 | -0.37 | |
| Korea Stock Exchange KOSPI Ind | 2012.7 | -0.42 | |
| Russian Depositary Index USD | 1119.21 | -0.44 | |
| Shanghai Stock Exchange Compos | 3037.074 | -0.48 | |
| S&P BSE SENSEX Index | 27859.33 | -0.50 | |
| Deutsche Boerse AG German Stoc | 9981.24 | -0.85 | |
| MICEX Index | 1915.89 | -1.29 | |
| Russian Trading System Cash In | 951.24 | -1.29 | |
| Borsa Istanbul 100 Index | 76177.81 | -8.03 |
Weekly Currency Performance
| Currency | Last | WkChPct | |
| USDCAD | 1.3023 | 0.62 | |
| USDJPY | 106.12 | 0.46 | |
| USDINR | 67.18 | 0.14 | |
| USDRUB | 63.3695 | 0.07 | |
| USDBRL | 3.2498 | -0.93 |
Weekly Commodities Performance
| name | units | Price | WeekCh | |
| Rice | USD/CWT | 10.82 | 2.46 | |
| Palladium | USD/T OZ. | 654.53 | 1.90 | |
| Copper | USD/MT | 4984.00 | 1.34 | |
| Oats | USD/BU. | 206.00 | 1.23 | |
| Sugar | USD/LB. | 19.36 | 0.26 | |
| GOLD | USD/T OZ. | 1331.20 | 0.14 | |
| Platinum | USD/T OZ. | 1087.10 | -0.12 | |
| Cattle | USD/LB. | 109.48 | -0.34 | |
| Silver | USD/T OZ. | 19.91 | -0.40 | |
| Coffee | USD/LB. | 146.55 | -0.68 | |
| Wheat | USD/BU. | 421.25 | -1.63 | |
| OIL Brent | USD/BBL. | 46.79 | -1.74 | |
| NATURAL GAS (NYMEX) | USD/MMBTU | 2.72 | -2.16 | |
| COCOA | USD/MT | 2998.00 | -2.19 | |
| Soybeans | USD/BU. | 1027.50 | -2.54 | |
| Hogs | USD/LB. | 64.30 | -2.58 | |
| Corn | USD/BU. | 350.75 | -3.04 |
Weekly Bond Rates Performance Change in btps
| country | yield | Wk | 1m | 1y | |
| GREECE | 7.71% | 9 | +13 | -318 | |
| SWITZERLAND | -0.60% | 1 | -11 | -60 | |
| SOUTH KOREA | 1.41% | 1 | -22 | -105 | |
| ITALY | 1.23% | 0 | -20 | -67 | |
| JAPAN » | -0.24% | 0 | -8 | -66 | |
| HONG KONG | 0.90% | 0 | -18 | -92 | |
| CANADA | 1.07% | -1 | -13 | -50 | |
| GERMANY » | -0.03% | -1 | -8 | -79 | |
| FRANCE | 0.20% | -1 | -22 | -83 | |
| NETHERLANDS | 0.08% | -1 | -20 | -83 | |
| UNITED STATES » | 1.55% | -2 | -14 | -83 | |
| BRAZIL | 11.90% | -2 | -75 | -52 | |
| SINGAPORE | 1.69% | -2 | -43 | -98 | |
| INDIA | 7.26% | -2 | -23 | -58 | |
| UNITED KINGDOM » | 0.80% | -3 | -44 | -126 | |
| SPAIN | 1.18% | -3 | -29 | -75 | |
| PORTUGAL | 3.05% | -3 | -7 | +49 | |
| MEXICO | 5.94% | -4 | -8 | -7 | |
| NEW ZEALAND | 2.26% | -5 | -22 | -117 |
Weekly GEM Sov. Bond Rates Performance Change in btps
Data in this table is from last Thursday Fixed Income update
| Country | Average Yield | Yield Average change % pts | |
| China | 2.59 | 0.06 | |
| Kazakhstan | 4.68 | 0.05 | |
| Uruguay | 3.97 | 0.02 | |
| Russian Federation | 4.02 | 0.01 | |
| Philippines | 2.45 | 0.01 | |
| United States | 0.48 | 0.01 | |
| Malaysia | 3.44 | -0.04 | |
| Oman | 4.76 | -0.04 | |
| Peru | 3.44 | -0.04 | |
| Turkey | 4.10 | -0.05 | |
| Slovak Republic | 1.74 | -0.05 | |
| Colombia | 3.68 | -0.05 | |
| Hungary | 3.35 | -0.07 | |
| Croatia (Hrvatska) | 4.08 | -0.07 | |
| Serbia | 3.61 | -0.08 | |
| Romania | 3.30 | -0.08 | |
| Chile | 2.70 | -0.10 | |
| Indonesia | 3.96 | -0.10 | |
| Mexico | 3.92 | -0.10 | |
| Panama | 2.87 | -0.11 | |
| Poland | 2.28 | -0.12 | |
| Paraguay | 5.28 | -0.12 | |
| El Salvador | 7.88 | -0.13 | |
| Ecuador | 10.20 | -0.14 | |
| Lebanon | 6.37 | -0.14 | |
| Brazil | 4.70 | -0.15 | |
| Lithuania | 2.15 | -0.15 | |
| Vietnam | 4.03 | -0.17 | |
| Azerbaijan | 5.08 | -0.25 | |
| Jamaica | 5.68 | -0.26 | |
| Argentina | 6.11 | -0.26 | |
| Pakistan | 5.79 | -0.28 | |
| Costa Rica | 5.89 | -0.28 | |
| Egypt | 6.02 | -0.28 | |
| Ukraine | 8.07 | -0.29 | |
| Dominican Republic | 5.05 | -0.30 | |
| South Africa | 4.29 | -0.31 | |
| Iraq | 9.82 | -0.36 | |
| Morocco | 2.87 | -0.36 | |
| Cote D'Ivoire (Ivory Coast) | 6.19 | -0.39 | |
| Tunisia | 6.44 | -0.40 | |
| Sri Lanka | 5.40 | -0.43 | |
| Venezuela | 27.01 | -0.45 | |
| Ghana | 9.91 | -0.52 | |
| Zambia | 10.23 | -0.52 | |
| Kenya | 7.38 | -0.52 | |
| Angola | 10.08 | -0.53 | |
| Ethiopia | 7.06 | -0.67 | |
| Gabon | 8.16 | -0.82 | |
| Mongolia | 7.01 | -1.17 |
Chart: China Steel Prices Came off May peaks, but stable
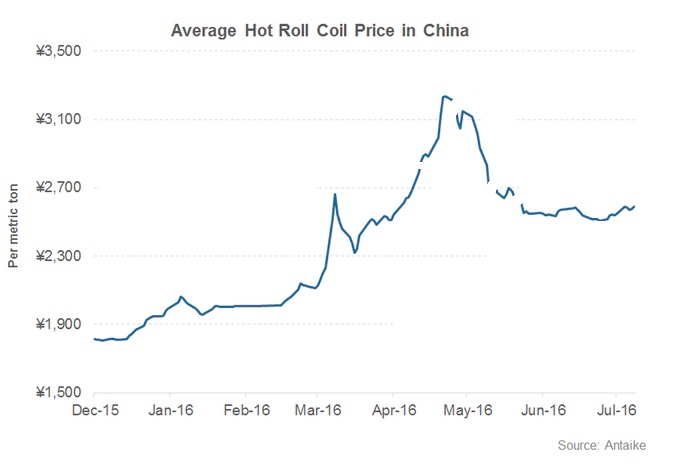
Source: Antaike, Market Realist
Market Comment Political & Economic News Today's Economic Events Today's Stock Results Recent ML Reports
Key Comment
Best since the start of the week among various stock markets was Ibovespa Brasil Sao Paulo Stoc +2.01%, Jakarta Stock Exchange Composi +1.71%, Warsaw Stock Exchange WIG Tota +1.56%, Nikkei 225 +1.05%,
While worst since the start of the week among various stock markets was Borsa Istanbul 100 Index -8.03%, MICEX Index -1.29%, Russian Trading System Cash In -1.29%, Deutsche Boerse AG German Stoc -0.85%,
Best week to date in FX space vs. greenback was USDBRL +0.93%, USDRUB-0.07%, USDINR-0.14%,
While worst week to date in FX space vs. greenback was USDCAD -0.62%, USDJPY -0.46%, USDINR -0.14%,
Best among commodities versus last Friday close was Rice +2.46%, Palladium +1.90%, Copper +1.34%,
While worst among commodities versus last Friday close was Corn -3.04%, Hogs -2.58%, Soybeans -2.54%,
Best among bonds since week to date week was NEW ZEALAND +5bpts, MEXICO +4bpts,
While worst among bonds since week to date week was GREECE -9bpts, SOUTH KOREA -1bpts,
News
Turkey
Brazil
Russia
China
South Africa
Australia
Korea
India
Canada
Econ Events Today
2016-07-20 Turkey Consumer Confidence JUL
2016-07-20 Turkey Central Government Debt JUN
2016-07-20 South Africa Core Inflation Rate YoY JUN
2016-07-20 South Africa Inflation Rate YoY JUN
2016-07-20 South Africa Inflation Rate MoM JUN
2016-07-20 Australia Westpac Leading Index MoM JUN
2016-07-20 US MBA Mortgage Applications 15/JUL
2016-07-20 US MBA 30-Year Mortgage Rate 15/JUL
2016-07-20 US EIA Crude Oil Stocks Change 15/JUL
2016-07-20 US EIA Gasoline Stocks Change 15/JUL
2016-07-20 EU Current Account MAY
2016-07-20 EU Consumer Confidence Flash JUL
Econ Events Yesterday
2016-07-19 Russia Retail Sales YoY JUN
2016-07-19 Russia Unemployment Rate JUN
2016-07-19 Russia Real Wage Growth YoY JUN
2016-07-19 Turkey TCMB Interest Rate Decision
2016-07-19 Turkey TCMB Overnight Lending Rate
2016-07-19 BRazil Federal Tax Revenues JUN
2016-07-19 Australia RBA Meeting Minutes
2016-07-19 US Overall Net Capital Flows MAY
2016-07-19 US Foreign Bond Investment MAY
2016-07-19 US Net Long-term Tic Flows MAY
2016-07-19 US Building Permits JUN
2016-07-19 US Building Permits MoM JUN
2016-07-19 US Housing Starts JUN
2016-07-19 US Housing Starts MoM JUN
2016-07-19 US Redbook YoY 16/JUL
2016-07-19 US Redbook MoM 16/JUL
2016-07-19 US 4-Week Bill Auction
2016-07-19 US 52-Week Bill Auction
2016-07-19 EU Construction Output YoY MAY
2016-07-19 EU ZEW Economic Sentiment Index JUL
Results
Our Recent Research Reports
Select Equity Data Snapshot
Best Dividends
| value | Stock | Origin | Dividend Yield |
| BR Properties SA | BRPR3:BZ | Brazil | 26.41 |
| Surgutneftegas OJSC | SNGSP:RM | Russia | 17.90 |
| Guangzhou R&F Properties Co Ltd | 2777:HK | China | 14.10 |
| Huaneng Power International Inc | 902:HK | China | 11.93 |
| Severstal PJSC | CHMF:RM | Russia | 11.60 |
| National Australia Bank Ltd | NAB:AU | Australia | 11.55 |
| Australia & New Zealand Banking Group Ltd | ANZ:AU | Australia | 10.84 |
| Mobile TeleSystems PJSC | MBT:US | Russia | 10.45 |
| Tupras Turkiye Petrol Rafinerileri AS | TUPRS:TI | Turkey | 10.18 |
| Datang International Power Generation Co Ltd | 991:HK | China | 10.06 |
| Bendigo & Adelaide Bank Ltd | BEN:AU | Australia | 10.02 |
| Westpac Banking Corp | WBC:AU | Australia | 9.45 |
| Evergrande Real Estate Group Ltd | 3333:HK | China | 9.36 |
| MTN Group Ltd | MTN:SJ | South Africa | 9.15 |
| Rural Electrification Corp Ltd | RECL:IN | India | 9.12 |
| Rio Tinto Ltd | RIO:AU | Australia | 8.95 |
| Parkson Retail Group Ltd | 3368:HK | China | 8.64 |
| LSR Group PJSC | LSRG:LI | Russia | 8.56 |
| Coal India Ltd | COAL:IN | India | 8.51 |
| Federal Grid PJSC | FEES:RM | Russia | 8.43 |
Select FI Data Snapshot
Country Average Sovereign Yield Change USD Eurobonds Weekly
| Country | Average Yield | Yield Average change % pts |
| China | 2.59 | 0.06 |
| Kazakhstan | 4.68 | 0.05 |
| Uruguay | 3.97 | 0.02 |
| Russian Federation | 4.02 | 0.01 |
| Philippines | 2.45 | 0.01 |
| United States | 0.48 | 0.01 |
| Malaysia | 3.44 | -0.04 |
| Oman | 4.76 | -0.04 |
| Peru | 3.44 | -0.04 |
| Turkey | 4.10 | -0.05 |
| Slovak Republic | 1.74 | -0.05 |
| Colombia | 3.68 | -0.05 |
| Hungary | 3.35 | -0.07 |
| Croatia (Hrvatska) | 4.08 | -0.07 |
| Serbia | 3.61 | -0.08 |
| Romania | 3.30 | -0.08 |
| Chile | 2.70 | -0.10 |
| Indonesia | 3.96 | -0.10 |
| Mexico | 3.92 | -0.10 |
| Panama | 2.87 | -0.11 |
| Poland | 2.28 | -0.12 |
| Paraguay | 5.28 | -0.12 |
| El Salvador | 7.88 | -0.13 |
| Ecuador | 10.20 | -0.14 |
| Lebanon | 6.37 | -0.14 |
| Brazil | 4.70 | -0.15 |
| Lithuania | 2.15 | -0.15 |
| Vietnam | 4.03 | -0.17 |
| Azerbaijan | 5.08 | -0.25 |
| Jamaica | 5.68 | -0.26 |
| Argentina | 6.11 | -0.26 |
| Pakistan | 5.79 | -0.28 |
| Costa Rica | 5.89 | -0.28 |
| Egypt | 6.02 | -0.28 |
| Ukraine | 8.07 | -0.29 |
| Dominican Republic | 5.05 | -0.30 |
| South Africa | 4.29 | -0.31 |
| Iraq | 9.82 | -0.36 |
| Morocco | 2.87 | -0.36 |
| Cote D'Ivoire (Ivory Coast) | 6.19 | -0.39 |
| Tunisia | 6.44 | -0.40 |
| Sri Lanka | 5.40 | -0.43 |
| Venezuela | 27.01 | -0.45 |
| Ghana | 9.91 | -0.52 |
| Zambia | 10.23 | -0.52 |
| Kenya | 7.38 | -0.52 |
| Angola | 10.08 | -0.53 |
| Ethiopia | 7.06 | -0.67 |
| Gabon | 8.16 | -0.82 |
| Mongolia | 7.01 | -1.17 |