Midlincoln Aggregates for funds
for week ending last Friday (inclusive)
| Focus | Objective | Asset Class | Flow USD mn |
| Commodities | INDUSTRIAL METALS | Commodity | -13.68 |
| Commodities | PRECIOUS METAL SECTOR | Equity | -593.83 |
| Commodities | PRECIOUS METALS | Commodity | 3154.37 |
| Commodities | PRECIOUS METALS | Mixed Allocation | 30.50 |
| country | AUSTRALIA | Equity | 14.20 |
| country | AUSTRALIA | Fixed Income | 32.34 |
| country | BRAZIL | Alternative | 0.00 |
| country | BRAZIL | Equity | -135.25 |
| country | BRAZIL | Fixed Income | -4705.91 |
| country | CHINA | Equity | 4488.58 |
| country | CHINA | Fixed Income | -40.67 |
| country | INDIA | Equity | -122.40 |
| country | INDIA | Fixed Income | -33.62 |
| country | ISRAEL | Equity | -1.47 |
| country | JAPAN | Equity | -189209.57 |
| country | JAPAN | Fixed Income | -1325.19 |
| country | JAPAN | Mixed Allocation | -0.26 |
| country | KOREA | Equity | -187.27 |
| country | POLAND | Equity | 3.65 |
| country | RUSSIA | Equity | -581.14 |
| country | RUSSIA | Fixed Income | 1.35 |
| country | SOUTH AFRICA | Equity | 0.75 |
| country | SPAIN | Equity | -123.69 |
| Country | TAIWAN | Equity | -6.12 |
| country | TURKEY | Equity | 17.13 |
| country | UNITED KINGDOM | Equity | 592.86 |
| industry | BASIC MATERIALS SECTOR | Equity | -3774.74 |
| industry | COMMUNICATIONS SECTOR | Equity | -373.58 |
| industry | ENERGY SECTOR | Equity | -772.85 |
| industry | FINANCIAL SECTOR | Equity | -189.84 |
| industry | HEALTH CARE SECTOR | Equity | -1720.40 |
| industry | INDUSTRIAL SECTOR | Equity | 89.62 |
| industry | MULTIPLE SECTOR | Equity | -12.75 |
| industry | NATURAL RESOURCES SECTOR | Equity | -220.74 |
| industry | REAL ESTATE SECTOR | Alternative | -1.56 |
| industry | REAL ESTATE SECTOR | Equity | 1052.97 |
| industry | TECHNOLOGY SECTOR | Equity | -1311.01 |
| industry | UTILITIES SECTOR | Equity | 623.12 |
| region | AFRICAN REGION | Equity | 12.39 |
| region | AFRICAN REGION | Fixed Income | -0.51 |
| region | ASIAN PACIFIC REGION | Equity | -2234.77 |
| region | ASIAN PACIFIC REGION | Fixed Income | 603.20 |
| region | ASIAN PACIFIC REGION | Mixed Allocation | 109.49 |
| region | ASIAN PACIFIC REGION EX JAPAN | Equity | -3538.21 |
| region | ASIAN PACIFIC REGION EX JAPAN | Fixed Income | 1252.46 |
| region | ASIAN PACIFIC REGION EX JAPAN | Mixed Allocation | -4.73 |
| region | EASTERN EUROPEAN REGION | Equity | 784.35 |
| region | EASTERN EUROPEAN REGION | Fixed Income | 1.50 |
| region | EASTERN EUROPEAN REGION | Mixed Allocation | -1.95 |
| region | EUROPEAN REGION | Equity | -5443.07 |
| region | EUROPEAN REGION | Fixed Income | -4983.29 |
| region | EUROPEAN REGION | Mixed Allocation | 0.05 |
| region | LATIN AMERICAN REGION | Equity | -1617.00 |
| region | LATIN AMERICAN REGION | Fixed Income | -836.35 |
| region | MIDDLE EAST REGION | Equity | -83.23 |
| region | MIDDLE EAST REGION | Fixed Income | -0.47 |
| region | NORDIC REGION | Equity | -166.57 |
| region | NORTH AMERICAN REGION | Equity | 323.58 |
| region | NORTH AMERICAN REGION | Fixed Income | 7.22 |
| Risk | GOVERNMENT BOND | Equity | 0.30 |
| Risk | GOVERNMENT BOND | Fixed Income | 20.52 |
| Risk | GOVERNMENT BOND | Mixed Allocation | -0.21 |
| Risk | INFLATION PROTECTED | Brazil | -0.68 |
| Risk | INFLATION PROTECTED | Fixed Income | 892.28 |
| Risk | LONG SHORT | Alternative | -884.87 |
| Risk | LONG SHORT | Equity | -56887.42 |
| Risk | LONG SHORT | Fixed Income | -1.63 |
| Risk | LONG SHORT | Mixed Allocation | 0.00 |
| Sector | AGRICULTURE | Commodity | -24.16 |
| Sector | AGRICULTURE | Equity | -0.01 |
| Sector | CONSUMER DISCRETIONARY | Equity | -638.91 |
| Sector | CONSUMER STAPLES | Equity | 561.94 |
| segment | BRIC | Equity | -305.03 |
| segment | BRIC | Fixed Income | -0.66 |
| segment | DEVELOPED MARKETS | Equity | -2646.84 |
| segment | EMEA | Equity | -0.43 |
| segment | EMEA | Fixed Income | 10.24 |
| segment | EMERGING MARKETS | Equity | 6239.36 |
| segment | GCC | Equity | -9.91 |
| segment | GCC | Fixed Income | -0.60 |
| segment | GCC | Mixed Allocation | -0.01 |
| segment | MENA | Equity | -1.72 |
| segment | MENA | Fixed Income | -0.43 |
| Size | LARGE-CAP | Equity | 7803.86 |
| Size | MID-CAP | Commodity | -0.51 |
| Size | MID-CAP | Equity | 1341.82 |
| Size | SMALL-CAP | Equity | 448.18 |
Source: Midlincoln Research
Fund Aggregates

Chart: Investors poured in $1.3 billion on July 14 into an exchange-traded fund that tracks the MSCI Emerging Markets Index
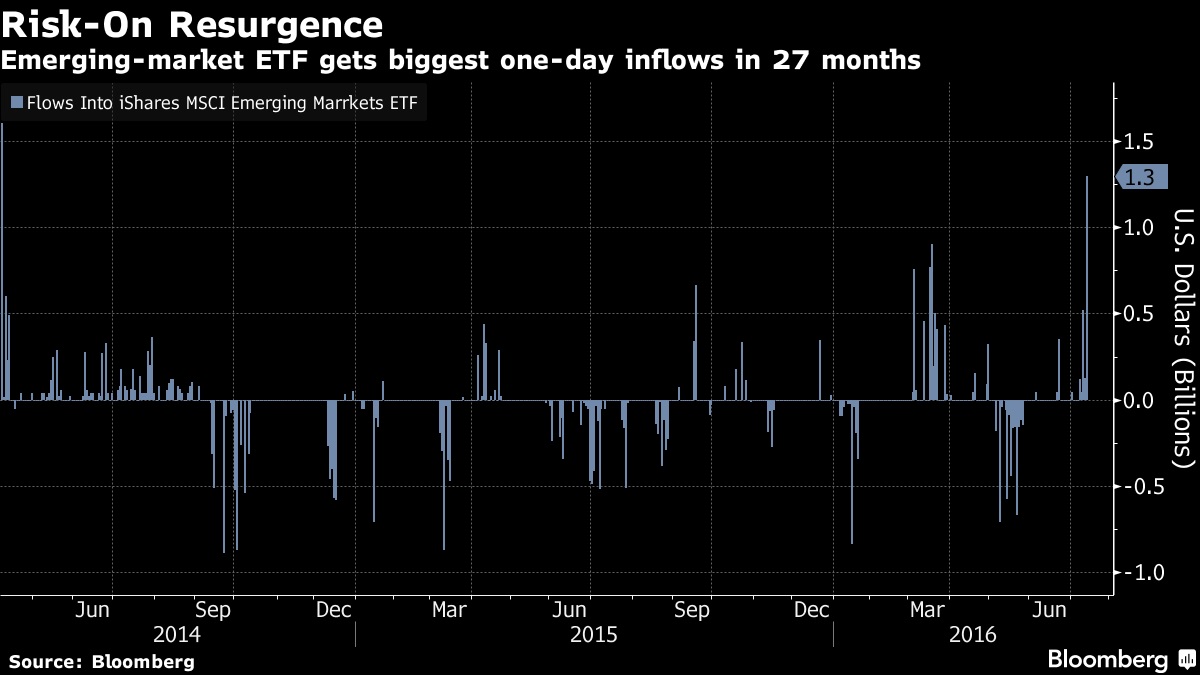
Source: Bloomberg
Emerging markets fund flow showed 6239.4 USD mn of inflow. While Frontier Markets funds showed -3.8 USD mn of outflows.
BRAZIL Alternative funds showed 0.0 USD mn of inflow.
BRAZIL Equity funds showed -135.2 USD mn of outflow.
BRAZIL Fixed Income funds showed -4705.9 USD mn of outflow.
CHINA Equity funds showed 4488.6 USD mn of inflow.
CHINA Fixed Income funds showed -40.7 USD mn of outflow.
INDIA Equity funds showed -122.4 USD mn of outflow.
INDIA Fixed Income funds showed -33.6 USD mn of outflow.
KOREA Equity funds showed -187.3 USD mn of outflow.
RUSSIA Equity funds showed -581.1 USD mn of outflow.
RUSSIA Fixed Income funds showed 1.4 USD mn of inflow.
SOUTH AFRICA Equity funds showed 0.8 USD mn of inflow.
TURKEY Equity funds showed 17.1 USD mn of inflow.
COMMUNICATIONS SECTOR Equity funds showed -373.6 USD mn of outflow.
ENERGY SECTOR Equity funds showed -772.9 USD mn of outflow.
FINANCIAL SECTOR Equity funds showed -189.8 USD mn of outflow.
REAL ESTATE SECTOR Alternative funds showed -1.6 USD mn of outflow.
REAL ESTATE SECTOR Equity funds showed 1053.0 USD mn of inflow.
TECHNOLOGY SECTOR Equity funds showed -1311.0 USD mn of outflow.
UTILITIES SECTOR Equity funds showed 623.1 USD mn of inflow.
LONG SHORT Alternative funds showed -884.9 USD mn of outflow.
LONG SHORT Equity funds showed -56887.4 USD mn of outflow.
LONG SHORT Fixed Income funds showed -1.6 USD mn of outflow.
LONG SHORT Mixed Allocation funds showed 0.0 USD mn of inflow.
It is worth noting that MidLincoln data shows flow dynamics for last week ending last Friday where as EPFR data reports data only to last Wednesday, which makes ML data far more relevant
Top 5 fund winners and Top 5 losers by country by inflow
Russia Inflows
| assclass | profile | flow USD mln$ |
| Equity | HSBC Global Investment Funds - Russia Equity | 53.62 |
| Equity | HSBC Global Investment Funds - Russia Equity | 22.97 |
| Equity | iShares MSCI Russi a ADR/GDR UCITS ETF | 20.83 |
| Equity | HSBC MSCI Russia Capped UCITS ETF $ is a | 6.10 |
| Fixed Income | DWS Russia Bond Fund is a "specialized" | 1.35 |
Russia Outflows
| assclass | profile | flow USD mln$ |
| Equity | Market Vectors Russia ETF is an exchange-traded | -99.99 |
| Equity | JPMorgan Funds - Russia Fund is an open-end | -99.99 |
| Equity | JPMorgan Funds - Russia Fund is an open-end | -99.99 |
| Equity | LYXOR ETF RUSSIA (Dow Jones Russia GDR) - | -52.95 |
| Equity | LYXOR ETF RUSSIA Dow Jones Russia GDR - D | -50.75 |
Source: MidLincoln Research
China Inflows
| assclass | profile | flow USD mln$ |
| Equity | CSOP FTSE China A50 ETF is an exchange-traded | 99.99 |
| Equity | iShares Asia Trust - iShares FTSE A50 China | 99.99 |
| Equity | Morgan Stanley China A Share Fund is a non-diversified, | 90.97 |
| Equity | ChinaAMC ETF Series - ChinaAMC CSI 300 Index | 73.32 |
| Equity | Deutsche X-trackers Harvest CSI 300 China | 71.92 |
China Outflows
| assclass | profile | flow USD mln$ |
| Equity | iShares China Large-Cap ETF is an exchange-traded | -99.99 |
| Equity | BlackRock Global Funds - China Fund is an | -99.99 |
| Equity | HSBC Global Investment Funds - Chinese | -99.99 |
| Equity | HSBC Global Investment Funds - Chinese | -99.99 |
| Equity | China Fund, Inc. is a non-diversified, | -99.99 |
Source: MidLincoln Research
South Africa Inflows
| assclass | profile | flow USD mln$ |
| Equity | NEXT FUNDS FTSE/JSE Africa Top40 Linked Exchange | 0.76 |
| Equity | NEXT FUNDS FTSE/JSE Africa Top40 Linked | -0.01 |
South Africa Outflows
| assclass | profile | flow USD mln$ |
| Equity | NEXT FUNDS FTSE/JSE Africa Top40 Linked | -0.01 |
| Equity | NEXT FUNDS FTSE/JSE Africa Top40 Linked Exchange | 0.76 |
Source: MidLincoln Research
Korea Inflows
| assclass | profile | flow USD mln$ |
| Equity | Korea Equity Fund, Inc. is a non-diversified, | 5.88 |
| Equity | Baring Korea Feeder Fund is an open-end | 0.52 |
| Equity | Korea Equity Fund, Inc. is a non-diversified, | 0.44 |
| Equity | WisdomTree Korea Hedged Equity Fund is an | 0.23 |
| Equity | Enhanced Index Fund (Cayman) Ltd - Enhanced | 0.00 |
Korea Outflows
| assclass | profile | flow USD mln$ |
| Equity | Matthews Korea Fund is an open-end fund | -46.54 |
| Equity | JPMorgan Korea Fund is a unit trust incorporated | -36.17 |
| Equity | iShares MSCI South Korea Capped ETF is an | -29.12 |
| Equity | INVESCO Korean Equity Fund is a UCITS | -16.94 |
| Equity | INVESCO Korean Equity Fund is a UCITS certified | -16.43 |
Source: MidLincoln Research
India Inflows
| assclass | profile | flow USD mln$ |
| Equity | iShares MSCI India ETF is an exchange-traded | 99.99 |
| Equity | India Fund, Inc. is a non-diversified, closed-end | 82.95 |
| Equity | Franklin Templeton Investment Funds - Franklin | 39.11 |
| Equity | GS India Equity Portfolio is a Portfolio | 20.21 |
| Equity | AMUNDI ETF MSCI INDIA UCITS ETF is a UCITS | 7.24 |
India Outflows
| assclass | profile | flow USD mln$ |
| Equity | Aberdeen Global - India Equity Fund is | -99.99 |
| Equity | Vontobel India Fund is an open-end fund | -78.14 |
| Equity | iPath MSCI India Index ETN is an exchange-traded | -41.70 |
| Fixed Income | UTI Indian Fixed Income Fund PLC is an | -31.78 |
| Equity | HSBC Global Investment Funds - Indian Equity | -31.47 |
Source: MidLincoln Research
Turkey Inflows
| assclass | profile | flow USD mln$ |
| Equity | iShares MSCI Turkey UCITS ETF is an open-end, | 20.01 |
| Equity | db x-trackers MSCI Turkey Index UCITS ETF | -0.08 |
| Equity | The Lyxor ETF Turkey (DJ Turkey Titans 20) | -2.81 |
Turkey Outflows
| assclass | profile | flow USD mln$ |
| Equity | The Lyxor ETF Turkey (DJ Turkey Titans 20) | -2.81 |
| Equity | db x-trackers MSCI Turkey Index UCITS ETF | -0.08 |
| Equity | iShares MSCI Turkey UCITS ETF is an open-end, | 20.01 |
Source: MidLincoln Research
Brazil Inflows
| assclass | profile | flow USD mln$ |
| Equity | Lyxor ETF Brazil (Ibovespa) USD is an exchange | 23.94 |
| Equity | iShares MSCI Brazil UCITS ETF (Dist) is an | 16.64 |
| Equity | NEXT FUNDS Ibovespa Linked Exchange Traded | 1.52 |
| Equity | db x-trackers - MSCI Brazil TRN Index UCITS | 0.51 |
| Alternative | Advance Umbrella Fund PLC-Advance Brazil | 0.00 |
Brazil Outflows
| assclass | profile | flow USD mln$ |
| Equity | Handelsbanken Funds - Brazil is an open-end | -99.99 |
| Fixed Income | Aberdeen Global - Brazil Bond Fund is a | -99.99 |
| Fixed Income | Fondo Mutuo Security Fixed Income BRL is | -99.99 |
| Fixed Income | Santander FIC FI Renda Fixa I Credito Privado | -55.29 |
| Fixed Income | Quadris Environmental Forestry Fund PCC | -17.50 |
Source: MidLincoln Research
Australia Inflows
| assclass | profile | flow USD mln$ |
| Equity | iShares MSCI Australia UCITS ETF is an open-end, | 37.26 |
| Fixed Income | 34.08 | |
| Equity | The UBS (Irl) ETF Plc - MSCI Australia UCITS | 24.98 |
| Equity | Swisscanto AST Avant Aktien Ausland Index | 23.65 |
| Equity | Fidelity Funds - Australia Fund is an open-end | 20.07 |
Australia Outflows
| assclass | profile | flow USD mln$ |
| Equity | Candriam Equities L - Australia is a SICAV | -36.16 |
| Equity | Candriam Equities L - Australia is a SICAV | -32.10 |
| Equity | Fidelity Funds - Australia Fund is an open-end | -21.55 |
| Equity | Fidelity Funds - Australia Fund is an open-end | -18.24 |
| Equity | db x-trackers S&P/ASX 200 UCITS ETF (DR) | -14.66 |
Source: MidLincoln Research
Canada Inflows
Canada Outflows
Source: MidLincoln Research
Good luck! And don’t stay out of the market for too long. As the policy of being too cautious is the greatest risk of all.
Ovanes Oganisyan