Indexes
Currencies
Commodities
Rates
Index Performance
Changes between 2016-07-04 and 2016-07-08
| Ndex | Last | WkChPct | |
| Borsa Istanbul 100 Index | 78387.69 | 0.56 | |
| S&P/TSX Composite Index | 14134.46 | 0.50 | |
| Shanghai Stock Exchange Compos | 2991.382 | 0.41 | |
| Karachi Stock Exchange KSE100 | 37966.76 | 0.32 | |
| Jakarta Stock Exchange Composi | 4971.581 | 0.00 | |
| S&P 500 Index | 2097.9 | -0.24 | |
| Russian Depositary Index USD | 1080.21 | -0.28 | |
| Dow Jones Industrial Average | 17895.88 | -0.30 | |
| Ibovespa Brasil Sao Paulo Stoc | 52014.66 | -0.42 | |
| FTSE 100 Index | 6533.79 | -0.67 | |
| MICEX Index | 1882.41 | -0.75 | |
| S&P BSE SENSEX Index | 27124.3 | -0.85 | |
| Russian Trading System Cash In | 922.77 | -1.13 | |
| Warsaw Stock Exchange WIG Tota | 44077.16 | -1.51 | |
| Korea Stock Exchange KOSPI Ind | 1962.27 | -1.74 | |
| Mexican Stock Exchange Mexican | 45394.37 | -1.77 | |
| FTSE/JSE Africa All Share Inde | 51097.48 | -2.41 | |
| Hong Kong Hang Seng Index | 20510.83 | -2.85 | |
| Deutsche Boerse AG German Stoc | 9418.78 | -3.66 | |
| Nikkei 225 | 15170.32 | -3.78 |
Weekly Currency Performance
| Currency | Last | WkChPct | |
| USDBRL | 3.3675 | 4.05 | |
| USDNOK | 8.491 | 1.83 | |
| USDZAR | 14.761 | 1.47 | |
| USDAZN | 1.576 | 1.42 | |
| USDTRY | 2.9318 | 1.38 | |
| USDKRW | 1160.89 | 1.25 | |
| USDCAD | 1.3009 | 1.02 | |
| USDRUB | 64.2036 | 0.68 | |
| USDEUR | 0.9023 | 0.55 | |
| USDLVL | 0.63413 | 0.54 | |
| USDINR | 67.4625 | 0.41 | |
| USDCNY | 6.6866 | 0.36 | |
| USDKZT | 338.25 | 0.33 | |
| USDAUD | 1.3343 | 0.17 | |
| USDPKR | 104.83 | 0.11 | |
| USDJPY | 100.44 | -2.21 |
Weekly Commodities Performance
| name | units | Price | WeekCh | |
| Rice | USD/CWT | 10.88 | 4.11 | |
| COCOA | USD/MT | 3110.00 | 3.84 | |
| Oats | USD/BU. | 198.75 | 3.11 | |
| Platinum | USD/T OZ. | 1085.30 | 2.07 | |
| GOLD | USD/T OZ. | 1358.30 | 0.55 | |
| Palladium | USD/T OZ. | 606.73 | -0.46 | |
| Wheat | USD/BU. | 427.50 | -0.64 | |
| Cattle | USD/LB. | 111.80 | -1.04 | |
| Coffee | USD/LB. | 141.80 | -3.14 | |
| Corn | USD/BU. | 346.00 | -3.89 | |
| Silver | USD/T OZ. | 19.71 | -3.95 | |
| NATURAL GAS (NYMEX) | USD/MMBTU | 2.76 | -4.50 | |
| Hogs | USD/LB. | 80.13 | -4.55 | |
| Copper | USD/MT | 4687.00 | -4.56 | |
| Sugar | USD/LB. | 19.73 | -5.05 | |
| OIL Brent | USD/BBL. | 46.93 | -7.25 | |
| Soybeans | USD/BU. | 1029.50 | -9.49 |
Weekly Bond Rates Performance Change in btps
| country | yield | Wk | 1m | 1y | |
| BRAZIL | 12.25% | 11 | -16 | -42 | |
| GREECE | 7.75% | 7 | +56 | -1,083 | |
| PORTUGAL | 3.04% | 6 | -1 | +5 | |
| SPAIN | 1.18% | 4 | -25 | -104 | |
| MEXICO | 5.91% | 2 | -8 | -1 | |
| ITALY | 1.24% | 1 | -15 | -98 | |
| FRANCE | 0.13% | -2 | -28 | -99 | |
| SWITZERLAND | -0.68% | -2 | -19 | -64 | |
| NETHERLANDS | 0.03% | -3 | -24 | -94 | |
| SOUTH KOREA | 1.37% | -3 | -32 | -109 | |
| GERMANY » | -0.17% | -4 | -22 | -84 | |
| JAPAN » | -0.29% | -4 | -17 | -70 | |
| HONG KONG | 0.84% | -4 | -26 | -84 | |
| INDIA | 7.38% | -4 | -11 | -40 | |
| NEW ZEALAND | 2.23% | -6 | -36 | -117 | |
| UNITED STATES » | 1.36% | -8 | -34 | -83 | |
| CANADA | 0.97% | -8 | -22 | -54 | |
| UNITED KINGDOM » | 0.78% | -8 | -47 | -111 | |
| AUSTRALIA » | 1.87% | -12 | -27 | -87 | |
| SINGAPORE | 1.68% | -13 | -34 | -89 |
Weekly GEM Sov. Bond Rates Performance Change in btps
Data in this table is from last Thursday Fixed Income update
| Country | Average Yield | Yield Average change % pts | |
| Lebanon | 6.52 | 0.11 | |
| Slovak Republic | 1.95 | 0.06 | |
| Sri Lanka | 6.16 | 0.05 | |
| United States | 0.47 | 0.02 | |
| Pakistan | 6.31 | -0.01 | |
| Jamaica | 6.13 | -0.05 | |
| Paraguay | 5.70 | -0.06 | |
| China | 2.68 | -0.08 | |
| Hungary | 3.59 | -0.09 | |
| Poland | 2.56 | -0.10 | |
| El Salvador | 8.90 | -0.11 | |
| Lithuania | 2.40 | -0.11 | |
| Vietnam | 4.37 | -0.12 | |
| Philippines | 2.59 | -0.15 | |
| Malaysia | 3.63 | -0.16 | |
| Romania | 3.56 | -0.20 | |
| Egypt | 6.71 | -0.21 | |
| Croatia (Hrvatska) | 4.30 | -0.22 | |
| Uruguay | 4.21 | -0.22 | |
| Serbia | 3.78 | -0.23 | |
| Ecuador | 10.55 | -0.24 | |
| Argentina | 6.32 | -0.24 | |
| Panama | 3.14 | -0.25 | |
| Peru | 3.65 | -0.27 | |
| Gabon | 9.00 | -0.28 | |
| Dominican Republic | 5.61 | -0.28 | |
| Indonesia | 4.20 | -0.29 | |
| Tunisia | 7.19 | -0.29 | |
| Russian Federation | 4.05 | -0.31 | |
| Chile | 2.89 | -0.33 | |
| Turkey | 4.25 | -0.34 | |
| Costa Rica | 6.45 | -0.34 | |
| Mexico | 4.20 | -0.35 | |
| Kenya | 8.13 | -0.36 | |
| Kazakhstan | 4.72 | -0.38 | |
| Ethiopia | 7.73 | -0.38 | |
| Morocco | 3.32 | -0.41 | |
| Cote D'Ivoire (Ivory Coast) | 6.73 | -0.44 | |
| South Africa | 4.85 | -0.50 | |
| Ukraine | 8.44 | -0.53 | |
| Brazil | 4.99 | -0.53 | |
| Colombia | 3.82 | -0.53 | |
| Angola | 9.66 | -0.56 | |
| Azerbaijan | 5.26 | -0.62 | |
| Iraq | 10.37 | -0.62 | |
| Mongolia | 8.77 | -0.75 | |
| Ghana | 10.50 | -0.95 | |
| Zambia | 10.91 | -1.23 | |
| Venezuela | 27.48 | -2.43 |
Chart: South Africa GDP Growth is Slow
As a result Debt vs. GDP is on the rise
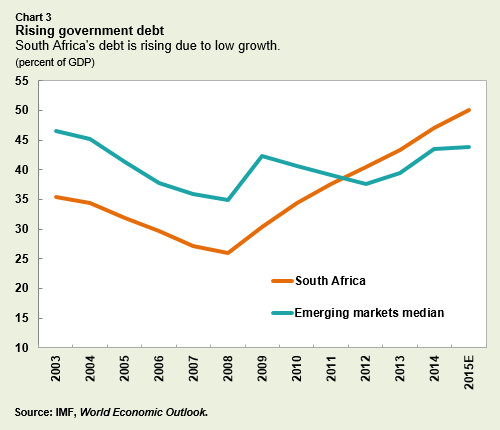
Source: IMF
Market Comment Political & Economic News Today's Economic Events Today's Stock Results Recent ML Reports
Key Comment
Best since the start of the week among various stock markets was Borsa Istanbul 100 Index +0.56%, S&P/TSX Composite Index +0.50%, Shanghai Stock Exchange Compos +0.41%, Karachi Stock Exchange KSE100 +0.32%,
While worst since the start of the week among various stock markets was Nikkei 225 -3.78%, Deutsche Boerse AG German Stoc -3.66%, Hong Kong Hang Seng Index -2.85%, FTSE/JSE Africa All Share Inde -2.41%,
Best week to date in FX space vs. greenback was USDJPY +2.21%, USDPKR-0.11%, USDAUD-0.17%,
While worst week to date in FX space vs. greenback was USDBRL -4.05%, USDNOK -1.83%, USDZAR -1.47%,
Best among commodities versus last Friday close was Rice +4.11%, COCOA +3.84%, Oats +3.11%,
While worst among commodities versus last Friday close was Soybeans -9.49%, OIL Brent -7.25%, Sugar -5.05%,
Best among bonds since week to date week was SINGAPORE +13bpts, AUSTRALIA » +12bpts,
While worst among bonds since week to date week was BRAZIL -11bpts, GREECE -7bpts,
News
South Africa
Australia
Korea
India
Canada
Turkey
Brazil
Russia
China
Econ Events Today
2016-07-08 Japan Eco Watchers Survey Outlook JUN
2016-07-08 Japan Current Account MAY
2016-07-08 Japan Bank Lending YoY JUN
2016-07-08 Japan Average Cash Earnings YoY MAY
2016-07-08 Japan Eco Watchers Survey Current JUN
2016-07-08 US Manufacturing Payrolls JUN
2016-07-08 US Non Farm Payrolls JUN
2016-07-08 US Nonfarm Payrolls Private JUN
2016-07-08 US Unemployment Rate JUN
2016-07-08 US Consumer Credit Change MAY
2016-07-08 US Average Hourly Earnings MoM JUN
2016-07-08 US Average Weekly Hours JUN
2016-07-08 US Government Payrolls JUN
2016-07-08 US Participation Rate JUN
2016-07-08 Canada Employment Change JUN
2016-07-08 Canada Full Time Employment Chg JUN
2016-07-08 Canada Participation Rate JUN
2016-07-08 Canada Part Time Employment Chg JUN
2016-07-08 Canada Unemployment Rate JUN
2016-07-08 India Foreign Reserves 1/JUL
2016-07-08 India Deposit Growth YoY 24/JUN
2016-07-08 India Bank Loan Growth 24/JUN
2016-07-08 BRazil Inflation Rate YoY JUN
2016-07-08 BRazil Inflation Rate MoM JUN
Econ Events Yesterday
2016-07-07 EU ECB Const�ncio Speech
2016-07-07 EU ECB Monetary Policy Meeting Accounts
2016-07-07 Japan Stock Investment by Foreigners 2/JUL
2016-07-07 Japan BoJ Gov Kuroda Speech
2016-07-07 Japan Coincident Index Prel MAY
2016-07-07 Japan Leading Economic Index Prel MAY
2016-07-07 Japan Foreign Bond Investment 02/JUL
2016-07-07 Japan Foreign Exchange Reserves JUN
2016-07-07 US Challenger Job Cuts JUN
2016-07-07 US Continuing Jobless Claims 25/JUN
2016-07-07 US Initial Jobless Claims JUL/02
2016-07-07 US JOLTs Job Openings MAY
2016-07-07 US EIA Natural Gas Stocks Change JUL/01
2016-07-07 US EIA Crude Oil Stocks Change JUL/01
2016-07-07 US EIA Gasoline Stocks Change 1/JUL
2016-07-07 Australia AIG Construction Index JUN
2016-07-07 Canada Building Permits MoM MAY
2016-07-07 Canada Ivey PMI s.a JUN
2016-07-07 Turkey End of Ramadan
2016-07-07 South Africa Foreign Exchange Reserves JUN
2016-07-07 Russia Foreign Exchange Reserves JUN
2016-07-07 China Foreign Exchange Reserves JUN
Results
Our Recent Research Reports
Select Equity Data Snapshot
Most Expensive Earnings
| value | Stock | Origin | PE |
| Zee Entertainment Enterprises Ltd | Z:IN | India | 49.4 |
| ACC Ltd | ACC:IN | India | 48.7 |
| Reliance Communications Ltd | RCOM:IN | India | 47.7 |
| Yandex NV | YNDX:US | Russia | 47.3 |
| Godrej Consumer Products Ltd | GCPL:IN | India | 46.4 |
| Titan Co Ltd | TTAN:IN | India | 46.4 |
| Hypermarcas SA | HYPE3:BZ | Brazil | 46.2 |
| Hindustan Unilever Ltd | HUVR:IN | India | 45.6 |
| Hindalco Industries Ltd | HNDL:IN | India | 45.3 |
| Hanwha Techwin Co Ltd | 012450:KS | Korea | 45.0 |
| Lotte Confectionery Co Ltd | 004990:KS | Korea | 44.9 |
| Amorepacific Corp | 090430:KS | Korea | 44.4 |
| Sun Pharmaceutical Industries Ltd | SUNP:IN | India | 43.7 |
| Reliance Capital Ltd | RCAPT:IN | India | 43.5 |
| Tencent Holdings Ltd | 700:HK | China | 43.4 |
| Restaurant Brands International Inc | QSR:CN | Canada | 42.0 |
| DLF Ltd | DLFU:IN | India | 41.9 |
| Dabur India Ltd | DABUR:IN | India | 41.5 |
| Cochlear Ltd | COH:AU | Australia | 40.5 |
| AMOREPACIFIC Group | 002790:KS | Korea | 40.3 |
Select FI Data Snapshot